Back impact (Viano 2001)#
Model validation information
Added to VIVA+ Validation Catalog on : 2022-06-28 by Jobin John
Version |
Date |
Performed by |
LS-Dyna |
|---|---|---|---|
0.3.2 |
2022-06-28 |
Jobin John |
9.3.1 |
1.1.1 |
2024-05-21 |
Jobin John |
12.2.1 |
© 2019-2024, OpenVT Organization (OVTO)
Available openly under under Creative Commons Attribution 4.0 International License 
Summary:#
The simulated outputs are compared to thecorridors taken from the references of PMHS tests reported by Viano et al., 2001.
Viano, D. C., Hardy, W. N., & King, A. I. (2001). Response of the Head, Neck and Torso to Pendulum Impacts on the Back. Journal of Crash Prevention and Injury Control, 2(4), 289-306. https://doi.org/10.1080/10286580108902573

Published in:#
John, J., Klug, C., Kranjec, M., Svenning, E., Iraeus, J. (2022). “Hello, world! VIVA+: A human body model lineup to evaluate sex-differences in crash protection.” Frontiers in bioengineering and biotechnology 10, https://doi.org/10.3389/fbioe.2022.918904
Experiments by Viano et al. (2001)#
Information on the subjects/specimens#
The experiments were carried out on 8 PMHS. The subjects had the age of 62 ± 12 years, body mass of 69 ± 17 kg and height of 173 ± 6 cm.
The test were conducted with a power-assisted pendulum with the weight of 23.4 kg. The cadavers were suspended upright with hands and arms forward. The top of the impactor face was aligned with T1 or T6 for the rear thoracic impacts. The pendulum interface was a smooth, flat circular disc with the diameter of 152 mm and rounded edges. The low-severity impacts were conducted at T1 and T6 followed by a high speed impact at T1. Low speed tests were nominally at 4.4m/s and the high-speed at 6.6 m/s.
Simulations#
Loading and Boundary Conditions#
6 loading configurations of hub impacts to the back were used. Both female and male models were impacted using a rigid hub with the diameter of 152 mm and weighing 23 kg. The impact velocities were 4.4m/s for low speed simulations and 6.6 m/s for high speed simulations. The impact locations were at the T1 and T6 vertebrae.
Configuration |
Location |
Impact v [m/s] |
Model |
|---|---|---|---|
1 |
T6 |
4.4 |
50F |
2 |
T6 |
4.4 |
50M |
3 |
T1 |
4.4 |
50F |
4 |
T1 |
4.4 |
50M |
5 |
T1 |
6.6 |
50F |
6 |
T1 |
6.6 |
50M |
Positioning#
For the validation purposes we used seated VIVA+ 50F and 50M models rotated for 23° around Y axis to get the torso somewhat vertical. The top of the impactor was aligned with the T1 or T6 for each model, depending on the loading condition.
simData_50F = pd.read_csv(os.path.join(result_output_dir_50F, dynasaur_output_file_name),
                          delimiter=';',
                          na_values='-',
                          #header = [0,1,2]
                          )
simData_50F
| MODEL | MODEL.1 | MODEL.2 | MODEL.3 | MODEL.4 | MODEL.5 | MODEL.6 | MODEL.7 | MODEL.8 | MODEL.9 | ... | Bone.46 | Bone.47 | Bone.48 | Bone.49 | Bone.50 | Bone.51 | Bone.52 | Bone.53 | Bone.54 | Bone.55 | |
|---|---|---|---|---|---|---|---|---|---|---|---|---|---|---|---|---|---|---|---|---|---|
| 0 | Added_Mass | Added_Mass | Total_Energy | Total_Energy | Internal_Energy | Internal_Energy | Kinetic_Energy | Kinetic_Energy | Hourglass_Energy | Hourglass_Energy | ... | T1_COG_az | T1_COG_az | T1_COG_ares | T1_COG_ares | TX_Sternum_Mid_x | TX_Sternum_Mid_x | TX_Sternum_Mid_y | TX_Sternum_Mid_y | TX_Sternum_Mid_z | TX_Sternum_Mid_z |
| 1 | time | mass | time | energy | time | energy | time | energy | time | energy | ... | time | acceleration | time | NaN | time | displacement | time | displacement | time | displacement |
| 2 | millisecond | kilogram | millisecond | kilogram * millimeter ** 2 / millisecond ** 2 | millisecond | kilogram * millimeter ** 2 / millisecond ** 2 | millisecond | kilogram * millimeter ** 2 / millisecond ** 2 | millisecond | kilogram * millimeter ** 2 / millisecond ** 2 | ... | millisecond | millimeter / millisecond ** 2 | millisecond | millimeter / millisecond ** 2 | millisecond | millimeter | millisecond | millimeter | millisecond | millimeter |
| 3 | 0.0 | 0.1294553428888321 | 0.0 | NaN | 0.0 | NaN | 0.0 | 222.8078155517578 | 0.0 | 0.0 | ... | 0.0 | 0.0 | 0.0 | 0.0 | 0.0 | 63.52961730957031 | 0.0 | 0.0 | 0.0 | 356.52252197265625 |
| 4 | 1.0 | 0.1295063351682317 | 1.0 | NaN | 1.0 | NaN | 1.0 | 223.13955412103707 | 1.0 | 0.17981378894108244 | ... | 0.1 | 0.0001513632328436225 | 0.1 | 0.0011445451941492293 | 0.1 | 63.52961730957031 | 0.1 | -4.450748426487436e-09 | 0.1 | 356.52252197265625 |
| ... | ... | ... | ... | ... | ... | ... | ... | ... | ... | ... | ... | ... | ... | ... | ... | ... | ... | ... | ... | ... | ... |
| 998 | NaN | NaN | NaN | NaN | NaN | NaN | NaN | NaN | NaN | NaN | ... | 99.5 | -0.9152419428757964 | 99.5 | 1.6185873720832777 | 99.5 | 267.0218202224103 | 99.5 | 0.1834452536488317 | 99.5 | 304.0452808813994 |
| 999 | NaN | NaN | NaN | NaN | NaN | NaN | NaN | NaN | NaN | NaN | ... | 99.60000000000001 | 1.3965221166571158 | 99.60000000000001 | 1.4146553792905165 | 99.60000000000001 | 267.2014806025521 | 99.60000000000001 | 0.18641477878732626 | 99.60000000000001 | 303.9534224666296 |
| 1000 | NaN | NaN | NaN | NaN | NaN | NaN | NaN | NaN | NaN | NaN | ... | 99.7 | 0.6808542938287955 | 99.7 | 1.0488818207413066 | 99.7 | 267.38109528500155 | 99.7 | 0.18921529439903828 | 99.7 | 303.8614999469399 |
| 1001 | NaN | NaN | NaN | NaN | NaN | NaN | NaN | NaN | NaN | NaN | ... | 99.80000000000001 | -1.6710798995696632 | 99.80000000000001 | 1.7350783983090114 | 99.80000000000001 | 267.56032926154995 | 99.80000000000001 | 0.19050510397070974 | 99.80000000000001 | 303.7693271793483 |
| 1002 | NaN | NaN | NaN | NaN | NaN | NaN | NaN | NaN | NaN | NaN | ... | 99.9 | 0.5968510105950293 | 99.9 | 1.1543915087974765 | 99.9 | 267.73957386874656 | 99.9 | 0.1914508043586769 | 99.9 | 303.6762470908435 |
1003 rows × 68 columns
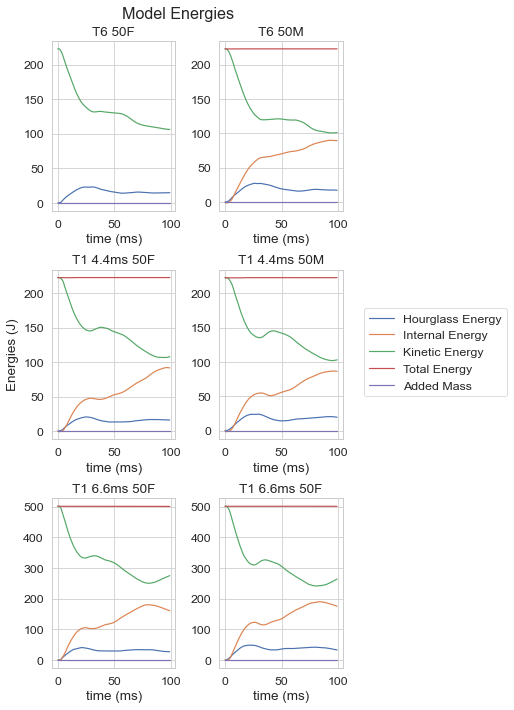
Model Energies#
Show code cell source
fig_energy, ((ax1, ax2), (ax3, ax4), (ax5, ax6)) = plt.subplots(3,2,figsize=(5, 10))
#fig_energy, (ax1, ax2, ax3, ax4, ax5, ax6) = plt.subplots(1,6)
fig_energy.suptitle('Model Energies')
#ax.set_title('Simulation #1')
ax3.set_ylabel('Energies (J)')

ax1.set(title='T6 50F', xlabel='time (ms)')
ax2.set(title='T6 50M', xlabel='time (ms)')
ax3.set(title='T1 4.4ms 50F', xlabel='time (ms)')
ax4.set(title='T1 4.4ms 50M', xlabel='time (ms)')
ax5.set(title='T1 6.6ms 50F', xlabel='time (ms)')
ax6.set(title='T1 6.6ms 50F', xlabel='time (ms)')

ax1.plot(simData_50F.MODEL.Hourglass_Energy.time, simData_50F.MODEL.Hourglass_Energy.energy, label="Hourglass Energy")
ax1.plot(simData_50F.MODEL.Internal_Energy.time, simData_50F.MODEL.Internal_Energy.energy, label="Internal Energy")
ax1.plot(simData_50F.MODEL.Kinetic_Energy.time, simData_50F.MODEL.Kinetic_Energy.energy, label="Kinetic Energy")
ax1.plot(simData_50F.MODEL.Total_Energy.time, simData_50F.MODEL.Total_Energy.energy, label="Total Energy")
ax1.plot(simData_50F.MODEL.Added_Mass.time, simData_50F.MODEL.Added_Mass.mass, label="Added Mass")


ax2.plot(simData_50M.MODEL.Hourglass_Energy.time, simData_50M.MODEL.Hourglass_Energy.energy)#, #label="Hourglass Energy")
ax2.plot(simData_50M.MODEL.Internal_Energy.time, simData_50M.MODEL.Internal_Energy.energy)#, #label="Internal Energy")
ax2.plot(simData_50M.MODEL.Kinetic_Energy.time, simData_50M.MODEL.Kinetic_Energy.energy)#, #label="Kinetic Energy")
ax2.plot(simData_50M.MODEL.Total_Energy.time, simData_50M.MODEL.Total_Energy.energy)#, #label="Total Energy")
ax2.plot(simData_50M.MODEL.Added_Mass.time, simData_50M.MODEL.Added_Mass.mass)#, #label="Added Mass")


ax3.plot(simData_50F_2.MODEL.Hourglass_Energy.time, simData_50F_2.MODEL.Hourglass_Energy.energy)#, #label="Hourglass Energy")
ax3.plot(simData_50F_2.MODEL.Internal_Energy.time, simData_50F_2.MODEL.Internal_Energy.energy)#, #label="Internal Energy")
ax3.plot(simData_50F_2.MODEL.Kinetic_Energy.time, simData_50F_2.MODEL.Kinetic_Energy.energy)#, label="Kinetic Energy")
ax3.plot(simData_50F_2.MODEL.Total_Energy.time, simData_50F_2.MODEL.Total_Energy.energy)#, #label="Total Energy")
ax3.plot(simData_50F_2.MODEL.Added_Mass.time, simData_50F_2.MODEL.Added_Mass.mass)#, #label="Added Mass")


ax4.plot(simData_50M_2.MODEL.Hourglass_Energy.time, simData_50M_2.MODEL.Hourglass_Energy.energy)#, #label="Hourglass Energy")
ax4.plot(simData_50M_2.MODEL.Internal_Energy.time, simData_50M_2.MODEL.Internal_Energy.energy)#, #label="Internal Energy")
ax4.plot(simData_50M_2.MODEL.Kinetic_Energy.time, simData_50M_2.MODEL.Kinetic_Energy.energy)#, #label="Kinetic Energy")
ax4.plot(simData_50M_2.MODEL.Total_Energy.time, simData_50M_2.MODEL.Total_Energy.energy)#, #label="Total Energy")
ax4.plot(simData_50M_2.MODEL.Added_Mass.time, simData_50M_2.MODEL.Added_Mass.mass)#, #label="Added Mass")

ax5.plot(simData_50F_3.MODEL.Hourglass_Energy.time, simData_50F_3.MODEL.Hourglass_Energy.energy) #label="Hourglass Energy")
ax5.plot(simData_50F_3.MODEL.Internal_Energy.time, simData_50F_3.MODEL.Internal_Energy.energy) #label="Internal Energy")
ax5.plot(simData_50F_3.MODEL.Kinetic_Energy.time, simData_50F_3.MODEL.Kinetic_Energy.energy) #label="Kinetic Energy")
ax5.plot(simData_50F_3.MODEL.Total_Energy.time, simData_50F_3.MODEL.Total_Energy.energy) #label="Total Energy")
ax5.plot(simData_50F_3.MODEL.Added_Mass.time, simData_50F_3.MODEL.Added_Mass.mass) #label="Added Mass")


ax6.plot(simData_50M_3.MODEL.Hourglass_Energy.time, simData_50M_3.MODEL.Hourglass_Energy.energy)#, label="Hourglass Energy")
ax6.plot(simData_50M_3.MODEL.Internal_Energy.time, simData_50M_3.MODEL.Internal_Energy.energy)#, label="Internal Energy")
ax6.plot(simData_50M_3.MODEL.Kinetic_Energy.time, simData_50M_3.MODEL.Kinetic_Energy.energy)#, label="Kinetic Energy")
ax6.plot(simData_50M_3.MODEL.Total_Energy.time, simData_50M_3.MODEL.Total_Energy.energy)#, label="Total Energy")
ax6.plot(simData_50M_3.MODEL.Added_Mass.time, simData_50M_2.MODEL.Added_Mass.mass)#, label="Added Mass")


fig_energy.tight_layout(pad=0.7)


fig_energy.legend(loc='center left', bbox_to_anchor=(1, 0.5));
Head Kinematics#
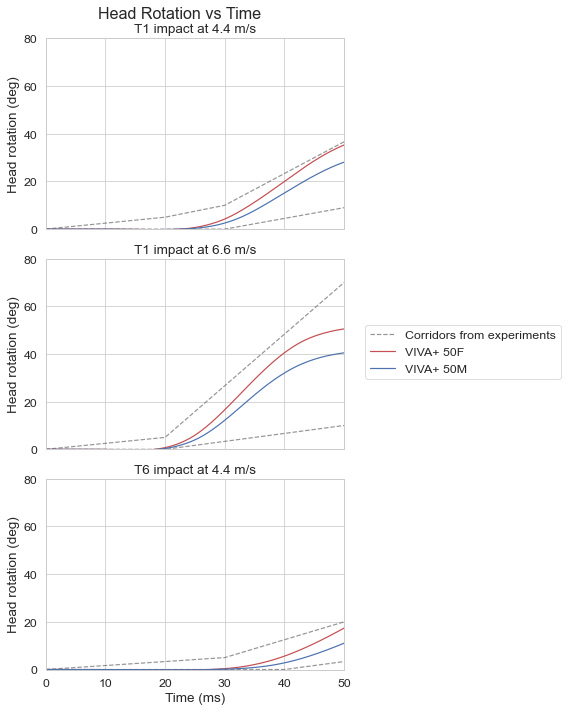
Head Rotation#
Show code cell source
fig_hr, axs = plt.subplots(nrows=3, ncols=1, sharex=True, sharey=True,figsize=(5, 10))
fig_hr.suptitle('Head Rotation vs Time')

axs[0].plot(experiment_head_rotation['Time-T1-4.4-lower (ms)'], experiment_head_rotation['Head-Rotation-T1-4.4-lower (deg)'], label="Corridors from experiments", **plotExperiment)
axs[0].plot(experiment_head_rotation['Time-T1-4.4-upper (ms)'], experiment_head_rotation['Head-Rotation-T1-4.4-upper (deg)'], **plotExperiment)
axs[0].set_title('T1 impact at 4.4 m/s')
axs[0].set_ylabel('Head rotation (deg)')

axs[0].plot(simData_50F_2.Bone.Head_COG_ry.time, -np.degrees(simData_50F_2.Bone.Head_COG_ry.displacement), label="VIVA+ 50F", **plot50F)
axs[0].plot(simData_50M_2.Bone.Head_COG_ry.time, -np.degrees(simData_50M_2.Bone.Head_COG_ry.displacement), label="VIVA+ 50M", **plot50M)
#axs[0].plot(simData_50F_2['Bone:Head_COG_ry:time[ms]'], -np.degrees(plotData_T1_4_4['Bone:Head_COG_ry:ry[rad]']))

axs[1].plot(experiment_head_rotation['Time-T1-6.6-lower (ms)'], experiment_head_rotation['Head-Rotation-T1-6.6-lower (deg)'], **plotExperiment)
axs[1].plot(experiment_head_rotation['Time-T1-6.6-upper (ms)'], experiment_head_rotation['Head-Rotation-T1-6.6-upper (deg)'], **plotExperiment)
axs[1].set_title('T1 impact at 6.6 m/s')
axs[1].set_ylabel('Head rotation (deg)')
axs[1].plot(simData_50F_3.Bone.Head_COG_ry.time, -np.degrees(simData_50F_3.Bone.Head_COG_ry.displacement), **plot50F)
axs[1].plot(simData_50M_3.Bone.Head_COG_ry.time, -np.degrees(simData_50M_3.Bone.Head_COG_ry.displacement), **plot50M)
#axs[1].plot(simData_50F_3['Bone:Head_COG_ry:time[ms]'], -np.degrees(plotData_T1_6_6['Bone:Head_COG_ry:ry[rad]']))

axs[2].plot(experiment_head_rotation['Time-T6-lower (ms)'], experiment_head_rotation['Head-Rotation-T6-lower (deg)'], **plotExperiment)
axs[2].plot(experiment_head_rotation['Time-T6-upper (ms)'], experiment_head_rotation['Head-Rotation-T6-upper (deg)'], **plotExperiment)
axs[2].set_title('T6 impact at 4.4 m/s')
axs[2].plot(simData_50F.Bone.Head_COG_ry.time, -np.degrees(simData_50F.Bone.Head_COG_ry.displacement), **plot50F)
axs[2].plot(simData_50M.Bone.Head_COG_ry.time, -np.degrees(simData_50M.Bone.Head_COG_ry.displacement),  **plot50M)

axs[2].set_xlabel('Time (ms)')
axs[2].set_ylabel('Head rotation (deg)');

plt.ylim([0, 80]);
plt.xlim([0, t_lim]);
fig_hr.legend(loc='center left', bbox_to_anchor=(1, 0.5))
fig_hr.tight_layout(pad=0.6)
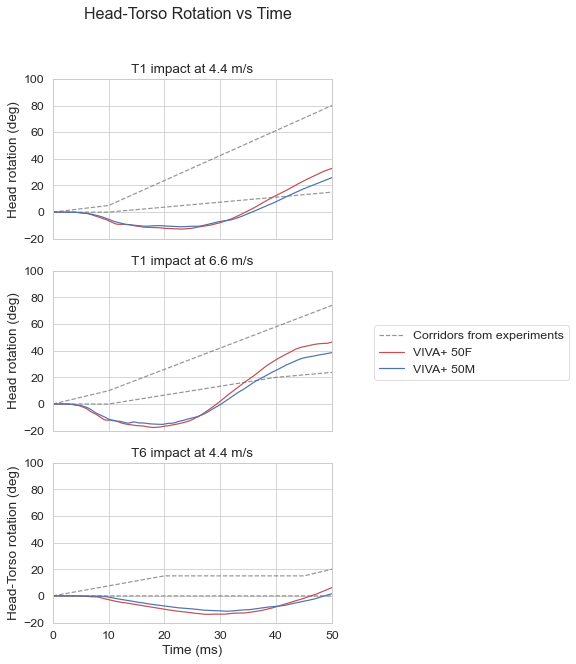
Head-Torso Rotation#
Show code cell source
fig_htr, axs = plt.subplots(nrows=3, ncols=1, sharex=True, sharey=True,figsize=(5, 10))
fig_htr.suptitle('Head-Torso Rotation vs Time')

axs[0].plot(ex_head_torso_rotation['Time-T1-4.4-lower (ms)'], ex_head_torso_rotation['Head-Torso-Rotation-T1-4.4-lower (deg)'], label="Corridors from experiments", **plotExperiment)
axs[0].plot(ex_head_torso_rotation['Time-T1-4.4-upper (ms)'], ex_head_torso_rotation['Head-Torso-Rotation-T1-4.4-upper (deg)'], **plotExperiment)
axs[0].set_title('T1 impact at 4.4 m/s')
axs[0].set_ylabel('Head rotation (deg)')
# negative sign is used to change the axis system
axs[0].plot(simData_50F_2.Bone.Head_COG_ry.time, -np.degrees(simData_50F_2.Bone.Head_COG_ry.displacement-simData_50F_2.Bone.T1_COG_ry.displacement), label="VIVA+ 50F", **plot50F)
axs[0].plot(simData_50M_2.Bone.Head_COG_ry.time, -np.degrees(simData_50M_2.Bone.Head_COG_ry.displacement-simData_50M_2.Bone.T1_COG_ry.displacement), label="VIVA+ 50M", **plot50M)
#axs[0].plot(plotData_T1_4_4['Bone:Head_COG_ry:time[ms]'], -np.degrees(plotData_T1_4_4['Bone:Head_COG_ry:ry[rad]']-plotData_T1_4_4['Bone:T1_COG_ry:ry[rad]']), color = 'red')

axs[1].plot(ex_head_torso_rotation['Time-T1-6.6-lower (ms)'], ex_head_torso_rotation['Head-Torso-Rotation-T1-6.6-lower (deg)'],**plotExperiment)
axs[1].plot(ex_head_torso_rotation['Time-T1-6.6-upper (ms)'], ex_head_torso_rotation['Head-Torso-Rotation-T1-6.6-upper (deg)'], **plotExperiment)
axs[1].set_title('T1 impact at 6.6 m/s')
axs[1].set_ylabel('Head rotation (deg)')
axs[1].plot(simData_50F_3.Bone.Head_COG_ry.time, -np.degrees(simData_50F_3.Bone.Head_COG_ry.displacement-simData_50F_3.Bone.T1_COG_ry.displacement), **plot50F)
axs[1].plot(simData_50M_3.Bone.Head_COG_ry.time, -np.degrees(simData_50M_3.Bone.Head_COG_ry.displacement-simData_50M_3.Bone.T1_COG_ry.displacement), **plot50M)
#axs[1].plot(plotData_T1_6_6['Bone:Head_COG_ry:time[ms]'], -np.degrees(plotData_T1_6_6['Bone:Head_COG_ry:ry[rad]']-plotData_T1_6_6['Bone:T1_COG_ry:ry[rad]']), color = 'red')

axs[2].plot(ex_head_torso_rotation['Time-T6-lower (ms)'], ex_head_torso_rotation['Head-Torso-Rotation-T6-lower (deg)'], **plotExperiment)
axs[2].plot(ex_head_torso_rotation['Time-T6-upper (ms)'], ex_head_torso_rotation['Head-Torso-Rotation-T6-upper (deg)'], **plotExperiment)
axs[2].set_title('T6 impact at 4.4 m/s')
axs[2].plot(simData_50F.Bone.Head_COG_ry.time, -np.degrees(simData_50F.Bone.Head_COG_ry.displacement-simData_50F.Bone.T1_COG_ry.displacement), **plot50F)
axs[2].plot(simData_50M.Bone.Head_COG_ry.time, -np.degrees(simData_50M.Bone.Head_COG_ry.displacement-simData_50M.Bone.T1_COG_ry.displacement), **plot50M)
#axs[2].plot(plotData_T6['Bone:Head_COG_ry:time[ms]'], -np.degrees(plotData_T6['Bone:Head_COG_ry:ry[rad]']-plotData_T6['Bone:T1_COG_ry:ry[rad]']), color = 'red')

axs[2].set_xlabel('Time (ms)')
axs[2].set_ylabel('Head-Torso rotation (deg)');
fig_htr.legend(loc='center left', bbox_to_anchor=(1, 0.5))
plt.xlim([0, t_lim]);
plt.ylim([-20,100])
(-20.0, 100.0)
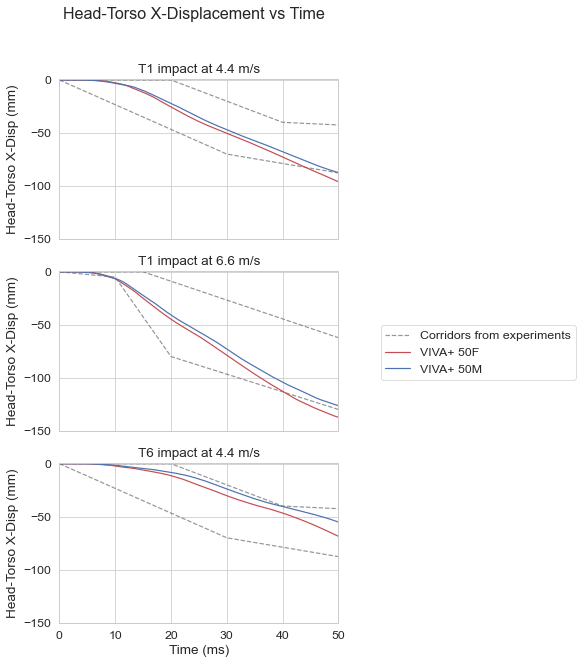
Head-Torso X-Displacement#
Show code cell source
fig_htx, axs = plt.subplots(nrows=3, ncols=1, sharex=True, sharey=True,figsize=(5, 10))
fig_htx.suptitle('Head-Torso X-Displacement vs Time')

axs[0].plot(ex_head_torso_x_disp['Time-T1-4.4-lower (ms)'], ex_head_torso_x_disp['Head-Torso-x-displacement-T1-4.4-lower (mm)'], label="Corridors from experiments", **plotExperiment)
axs[0].plot(ex_head_torso_x_disp['Time-T1-4.4-upper (ms)'], ex_head_torso_x_disp['Head-Torso-x-displacement-T1-4.4-upper (mm)'], **plotExperiment)
#negative sign is used to change the axis system

htx_simData_50F_2 = simData_50F_2.Bone.Head_COG_x.displacement - simData_50F_2.Bone.T1_COG_x.displacement

axs[0].plot(simData_50F_2.Bone.Head_COG_x.time, htx_simData_50F_2- htx_simData_50F_2.iloc[0], label="VIVA+ 50F", **plot50F)
htx_simData_50M_2 = simData_50M_2.Bone.Head_COG_x.displacement - simData_50M_2.Bone.T1_COG_x.displacement
axs[0].plot(simData_50M_2.Bone.Head_COG_x.time, htx_simData_50M_2- htx_simData_50M_2.iloc[0], label="VIVA+ 50M", **plot50M)
axs[0].set_title('T1 impact at 4.4 m/s')
axs[0].set_ylabel('Head-Torso X-Disp (mm)')

axs[1].plot(ex_head_torso_x_disp['Time-T1-6.6-lower (ms)'], ex_head_torso_x_disp['Head-Torso-x-displacement-T1-6.6-lower (mm)'], **plotExperiment)
axs[1].plot(ex_head_torso_x_disp['Time-T1-6.6-upper (ms)'], ex_head_torso_x_disp['Head-Torso-x-displacement-T1-6.6-upper (mm)'], **plotExperiment)
#htx_T1_6_6_50F = plotData_T1_6_6['Bone:Head_COG_x:x[mm]']-plotData_T1_6_6['Bone:T1_COG_x:x[mm]']
#axs[1].plot(plotData_T1_6_6['Bone:Head_COG_x:time[ms]'], htx_T1_6_6_50F - htx_T1_6_6_50F[0], color = 'red')
htx_simData_50F_3 = simData_50F_3.Bone.Head_COG_x.displacement - simData_50F_3.Bone.T1_COG_x.displacement
axs[1].plot(simData_50F_3.Bone.Head_COG_x.time, htx_simData_50F_3- htx_simData_50F_3.iloc[0], **plot50F)
htx_simData_50M_3 = simData_50M_3.Bone.Head_COG_x.displacement - simData_50M_3.Bone.T1_COG_x.displacement
axs[1].plot(simData_50M_3.Bone.Head_COG_x.time, htx_simData_50M_3- htx_simData_50M_3.iloc[0], **plot50M)
axs[1].set_title('T1 impact at 6.6 m/s')
axs[1].set_ylabel('Head-Torso X-Disp (mm)')

axs[2].plot(ex_head_torso_x_disp['Time-T6-lower (ms)'], ex_head_torso_x_disp['Head-Torso-x-displacement-T6-lower (mm)'], **plotExperiment)
axs[2].plot(ex_head_torso_x_disp['Time-T6-upper (ms)'], ex_head_torso_x_disp['Head-Torso-x-displacement-T6-upper (mm)'], **plotExperiment)
#htx_T6_50F = plotData_T6['Bone:Head_COG_x:x[mm]']-plotData_T6['Bone:T1_COG_x:x[mm]']
#axs[2].plot(plotData_T6['Bone:Head_COG_ry:time[ms]'], htx_T6_50F - htx_T6_50F[0], color = 'red')
htx_simData_50F = simData_50F.Bone.Head_COG_x.displacement - simData_50F.Bone.T1_COG_x.displacement
axs[2].plot(simData_50F.Bone.Head_COG_x.time, htx_simData_50F- htx_simData_50F.iloc[0] ,**plot50F)
htx_simData_50M = simData_50M.Bone.Head_COG_x.displacement - simData_50M.Bone.T1_COG_x.displacement
axs[2].plot(simData_50M.Bone.Head_COG_x.time, htx_simData_50M- htx_simData_50M.iloc[0] , **plot50M)
axs[2].set_title('T6 impact at 4.4 m/s')
axs[2].set_xlabel('Time (ms)')
axs[2].set_ylabel('Head-Torso X-Disp (mm)')
fig_htx.legend(loc='center left', bbox_to_anchor=(1, 0.5))

plt.xlim([0, t_lim]);
plt.ylim([-150, 1]);
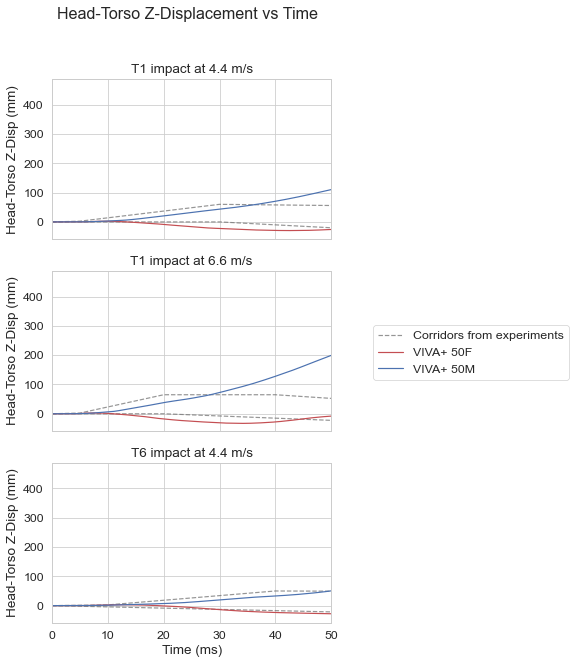
Head-Torso Z-Displacement#
Show code cell source
fig_htz, axs = plt.subplots(nrows=3, ncols=1, sharex=True, sharey=True,figsize=(5, 10))
fig_htz.suptitle('Head-Torso Z-Displacement vs Time')

axs[0].plot(ex_head_torso_z_disp['Time-T1-4.4-lower (ms)'], ex_head_torso_z_disp['Head-Torso-z-displacement-T1-4.4-lower (mm)'], label="Corridors from experiments", **plotExperiment)
axs[0].plot(ex_head_torso_z_disp['Time-T1-4.4-upper (ms)'], ex_head_torso_z_disp['Head-Torso-z-displacement-T1-4.4-upper (mm)'], **plotExperiment)
# negative sign is used to change the axis system
#htz_T1_4_4_50F = (plotData_T1_4_4['Bone:Head_COG_z:z[mm]']-plotData_T1_4_4['Bone:T1_COG_z:z[mm]'])
#axs[0].plot(plotData_T1_4_4['Bone:Head_COG_z:time[ms]'], htz_T1_4_4_50F - htz_T1_4_4_50F[0], color = 'red' )
htx_simData_50F_2 = simData_50F_2.Bone.Head_COG_z.displacement - simData_50F_2.Bone.T1_COG_z.displacement
axs[0].plot(simData_50F_2.Bone.Head_COG_z.time, -(htx_simData_50F_2- htx_simData_50F_2.iloc[0]) , label="VIVA+ 50F", **plot50F)
htx_simData_50M_2 = simData_50M_2.Bone.Head_COG_z.displacement - simData_50M_2.Bone.T1_COG_x.displacement
axs[0].plot(simData_50M_2.Bone.Head_COG_z.time, -(htx_simData_50M_2- htx_simData_50M_2.iloc[0]) , label="VIVA+ 50M", **plot50M)
axs[0].set_title('T1 impact at 4.4 m/s')
axs[0].set_ylabel('Head-Torso Z-Disp (mm)')


axs[1].plot(ex_head_torso_z_disp['Time-T1-6.6-lower (ms)'], ex_head_torso_z_disp['Head-Torso-z-displacement-T1-6.6-lower (mm)'], **plotExperiment)
axs[1].plot(ex_head_torso_z_disp['Time-T1-6.6-upper (ms)'], ex_head_torso_z_disp['Head-Torso-z-displacement-T1-6.6-upper (mm)'], **plotExperiment)
#htz_T1_6_6_50F = (plotData_T1_6_6['Bone:Head_COG_z:z[mm]']-plotData_T1_6_6['Bone:T1_COG_z:z[mm]'])
#axs[1].plot(plotData_T1_6_6['Bone:Head_COG_z:time[ms]'], htz_T1_6_6_50F - htz_T1_6_6_50F[0], color = 'red')
htx_simData_50F_3 = simData_50F_3.Bone.Head_COG_z.displacement - simData_50F_3.Bone.T1_COG_z.displacement
axs[1].plot(simData_50F_3.Bone.Head_COG_z.time, -(htx_simData_50F_3- htx_simData_50F_3.iloc[0]) , **plot50F)
htx_simData_50M_3 = simData_50M_3.Bone.Head_COG_z.displacement - simData_50M_3.Bone.T1_COG_x.displacement
axs[1].plot(simData_50M_3.Bone.Head_COG_z.time, -(htx_simData_50M_3- htx_simData_50M_3.iloc[0])  , **plot50M)
axs[1].set_title('T1 impact at 6.6 m/s')
axs[1].set_ylabel('Head-Torso Z-Disp (mm)')


axs[2].plot(ex_head_torso_z_disp['Time-T6-lower (ms)'], ex_head_torso_z_disp['Head-Torso-z-displacement-T6-lower (mm)'], **plotExperiment)
axs[2].plot(ex_head_torso_z_disp['Time-T6-upper (ms)'], ex_head_torso_z_disp['Head-Torso-z-displacement-T6-upper (mm)'], **plotExperiment)
#htz_T6_50F = (plotData_T6['Bone:Head_COG_z:z[mm]']-plotData_T6['Bone:T1_COG_z:z[mm]'])
##axs[2].plot(head_torso_rotation['Time-T6-lower (ms)'], head_torso_rotation['Head-Torso-Rotation-T6-lower (deg)'])
##axs[2].plot(head_torso_rotation['Time-T6-upper (ms)'], head_torso_rotation['Head-Torso-Rotation-T6-upper (deg)'])
#axs[2].plot(plotData_T6['Bone:Head_COG_z:time[ms]'], htz_T6_50F - htz_T6_50F[0], color = 'red' )
htx_simData_50F = simData_50F.Bone.Head_COG_z.displacement - simData_50F.Bone.T1_COG_z.displacement
axs[2].plot(simData_50F.Bone.Head_COG_z.time, -(htx_simData_50F- htx_simData_50F.iloc[0])  ,**plot50F)
htx_simData_50M = simData_50M.Bone.Head_COG_z.displacement - simData_50M.Bone.T1_COG_x.displacement
axs[2].plot(simData_50M.Bone.Head_COG_z.time, -(htx_simData_50M- htx_simData_50M.iloc[0]) , **plot50M)
##axs[2].plot(head_torso_rotation['Time-T6-lower (ms)'], head_torso_rotation['Head-Torso-Rotation-T6-lower (deg)'])
##axs[2].plot(head_torso_rotation['Time-T6-upper (ms)'], head_torso_rotation['Head-Torso-Rotation-T6-upper (deg)'])


axs[2].set_title('T6 impact at 4.4 m/s')
axs[2].set_xlabel('Time (ms)')
axs[2].set_ylabel('Head-Torso Z-Disp (mm)')

plt.xlim([0, t_lim]);
fig_htz.legend(loc='center left', bbox_to_anchor=(1, 0.5))
<matplotlib.legend.Legend at 0x1ca077e6280>
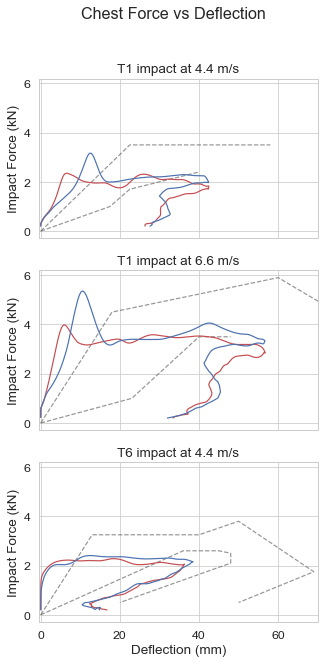
Chest Force and Deflection#
Chest Force vs Deflection#
Show code cell content
chest_deflection_50F_2 =  simData_50F_2.Bone.T8_COG_x.displacement - simData_50F_2.Bone.Sternum_PX_x.displacement
chest_deflection_50M_2 =  simData_50M_2.Bone.T8_COG_x.displacement - simData_50M_2.Bone.Sternum_PX_x.displacement

chest_deflection_50F_3 =  simData_50F_3.Bone.T8_COG_x.displacement - simData_50F_3.Bone.Sternum_PX_x.displacement
chest_deflection_50M_3 =  simData_50M_3.Bone.T8_COG_x.displacement - simData_50M_3.Bone.Sternum_PX_x.displacement

chest_deflection_50F =  simData_50F.Bone.T8_COG_x.displacement - simData_50F.Bone.Sternum_PX_x.displacement
chest_deflection_50M =  simData_50M.Bone.T8_COG_x.displacement - simData_50M.Bone.Sternum_PX_x.displacement
Show code cell source
## TODO: Define Deflection!!!
fig_fd, axs = plt.subplots(nrows=3, ncols=1, sharex=True, sharey=True,figsize=(5, 10))
fig_fd.suptitle('Chest Force vs Deflection')


axs[0].plot(ex_impact_force_deflection['Deflection-T1-4.4-lower (mm)'], ex_impact_force_deflection['Impact-Force-T1-4.4-lower (kN)'],label="corridors from experiments", **plotExperiment)
axs[0].plot(ex_impact_force_deflection['Deflection-T1-4.4-upper (mm)'], ex_impact_force_deflection['Impact-Force-T1-4.4-upper (kN)'], label="corridors from experiments", **plotExperiment)
axs[0].plot((chest_deflection_50F_2 -chest_deflection_50F_2.iloc[0])[simData_50F_2.IMPACTOR["Contactforce-impactor-to-HBM-m"].iloc[:,1] >0.2],
            simData_50F_2.IMPACTOR["Contactforce-impactor-to-HBM-m"].iloc[:,1][simData_50F_2.IMPACTOR["Contactforce-impactor-to-HBM-m"].iloc[:,1] >0.2] , **plot50F)
axs[0].plot((chest_deflection_50M_2 -chest_deflection_50M_2.iloc[0])[simData_50M_2.IMPACTOR["Contactforce-impactor-to-HBM-m"].iloc[:,1] >0.2],
            simData_50M_2.IMPACTOR["Contactforce-impactor-to-HBM-m"].iloc[:,1][simData_50M_2.IMPACTOR["Contactforce-impactor-to-HBM-m"].iloc[:,1] >0.2] , **plot50M)

axs[0].set_title('T1 impact at 4.4 m/s')
axs[0].set_ylabel('Impact Force (kN)')

axs[1].plot(ex_impact_force_deflection['Deflection-T1-6.6-lower (mm)'], ex_impact_force_deflection['Impact-Force-T1-6.6-lower (kN)'], **plotExperiment)
axs[1].plot(ex_impact_force_deflection['Deflection-T1-6.6-upper (mm)'], ex_impact_force_deflection['Impact-Force-T1-6.6-upper (kN)'], **plotExperiment)
axs[1].plot((chest_deflection_50F_3 -chest_deflection_50F_3.iloc[0])[simData_50F_3.IMPACTOR["Contactforce-impactor-to-HBM-m"].iloc[:,1] >0.2],
            simData_50F_3.IMPACTOR["Contactforce-impactor-to-HBM-m"].iloc[:,1][simData_50F_3.IMPACTOR["Contactforce-impactor-to-HBM-m"].iloc[:,1] >0.2] , **plot50F)
axs[1].plot((chest_deflection_50M_3 -chest_deflection_50M_3.iloc[0])[simData_50M_3.IMPACTOR["Contactforce-impactor-to-HBM-m"].iloc[:,1] >0.2],
            simData_50M_3.IMPACTOR["Contactforce-impactor-to-HBM-m"].iloc[:,1][simData_50M_3.IMPACTOR["Contactforce-impactor-to-HBM-m"].iloc[:,1] >0.2] , **plot50M)

axs[1].set_title('T1 impact at 6.6 m/s')
axs[1].set_ylabel('Impact Force (kN)')

axs[2].plot(ex_impact_force_deflection['Deflection-T6-4.4-lower (mm)'], ex_impact_force_deflection['Impact-Force-T6-4.4-lower (kN)'], **plotExperiment)
axs[2].plot(ex_impact_force_deflection['Deflection-T6-4.4-upper (mm)'], ex_impact_force_deflection['Impact-Force-T6-4.4-upper (kN)'], **plotExperiment)
axs[2].plot((chest_deflection_50F -chest_deflection_50F.iloc[0])[simData_50F.IMPACTOR["Contactforce-impactor-to-HBM-m"].iloc[:,1] >0.2],
            simData_50F.IMPACTOR["Contactforce-impactor-to-HBM-m"].iloc[:,1][simData_50F.IMPACTOR["Contactforce-impactor-to-HBM-m"].iloc[:,1] >0.2] , **plot50F)
axs[2].plot((chest_deflection_50M -chest_deflection_50M.iloc[0])[simData_50M.IMPACTOR["Contactforce-impactor-to-HBM-m"].iloc[:,1] >0.2],
            simData_50M.IMPACTOR["Contactforce-impactor-to-HBM-m"].iloc[:,1][simData_50M.IMPACTOR["Contactforce-impactor-to-HBM-m"].iloc[:,1] >0.2] , **plot50M)
axs[2].set_title('T6 impact at 4.4 m/s')

axs[2].set_xlabel('Deflection (mm)')
axs[2].set_ylabel('Impact Force (kN)');

plt.xlim([-0.5, 70]);
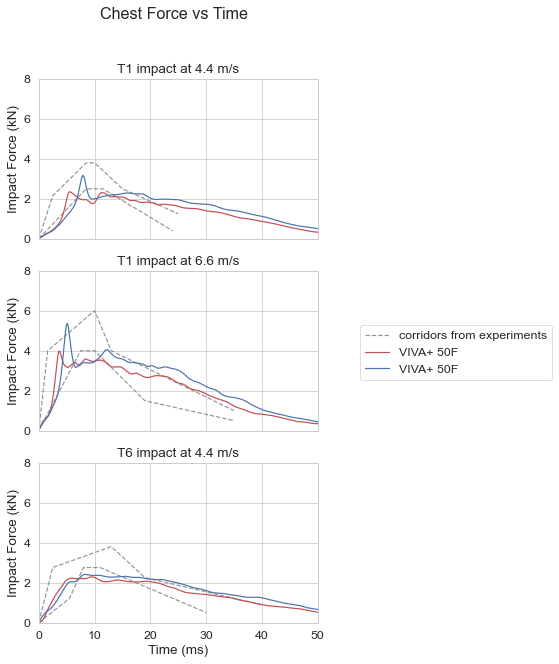
Impact force vs time#
Show code cell source
fig_ft, axs = plt.subplots(nrows=3, ncols=1, sharex=True, sharey=True,figsize=(5, 10))
fig_ft.suptitle('Chest Force vs Time')

axs[0].plot(ex_impact_force_time['Time-T1-4.4-lower (ms)'], ex_impact_force_time['Impact-Force-4.4-lower-T1 (kN)'],label="corridors from experiments", **plotExperiment)
axs[0].plot(ex_impact_force_time['Time-T1-4.4-upper (ms)'], ex_impact_force_time['Impact-Force-4.4-upper-T1 (kN)'], **plotExperiment)
axs[0].plot(simData_50F_2.IMPACTOR["Contactforce-impactor-to-HBM-m"].iloc[:,0], simData_50F_2.IMPACTOR["Contactforce-impactor-to-HBM-m"].iloc[:,1],  label="VIVA+ 50F", **plot50F)
axs[0].plot(simData_50M_2.IMPACTOR["Contactforce-impactor-to-HBM-m"].iloc[:,0], simData_50M_2.IMPACTOR["Contactforce-impactor-to-HBM-m"].iloc[:,1],  label="VIVA+ 50F", **plot50M)
axs[0].set_title('T1 impact at 4.4 m/s')
axs[0].set_ylabel('Impact Force (kN)')
#axs[0].plot(plotData_T1_4_4['Bone:Head_COG_z:time[ms]'], -plotData_T1_4_4['Bone:Head_COG_z:z[mm]'])

axs[1].plot(ex_impact_force_time['Time-T1-6.6-lower (ms)'], ex_impact_force_time['Impact-Force-lower-6.6-T1 (kN)'], **plotExperiment)
axs[1].plot(ex_impact_force_time['Time-T1-6.6-upper (ms)'], ex_impact_force_time['Impact-Force-6.6-upper-T1 (kN)'], **plotExperiment)
axs[1].plot(simData_50F_3.IMPACTOR["Contactforce-impactor-to-HBM-m"].iloc[:,0], simData_50F_3.IMPACTOR["Contactforce-impactor-to-HBM-m"].iloc[:,1],  **plot50F)
axs[1].plot(simData_50M_3.IMPACTOR["Contactforce-impactor-to-HBM-m"].iloc[:,0], simData_50M_3.IMPACTOR["Contactforce-impactor-to-HBM-m"].iloc[:,1],  **plot50M)
axs[1].set_title('T1 impact at 6.6 m/s')
axs[1].set_ylabel('Impact Force (kN)')

axs[2].plot(ex_impact_force_time['Time-T6-lower (ms)'], ex_impact_force_time['Impact-Force-lower-T6 (kN)'], **plotExperiment)
axs[2].plot(ex_impact_force_time['Time-T6-upper (ms)'], ex_impact_force_time['Impact-Force-upper-T6 (kN)'], **plotExperiment)
axs[2].plot(simData_50F.IMPACTOR["Contactforce-impactor-to-HBM-m"].iloc[:,0], simData_50F.IMPACTOR["Contactforce-impactor-to-HBM-m"].iloc[:,1],  **plot50F)
axs[2].plot(simData_50M.IMPACTOR["Contactforce-impactor-to-HBM-m"].iloc[:,0], simData_50M.IMPACTOR["Contactforce-impactor-to-HBM-m"].iloc[:,1],  **plot50M)
axs[2].set_title('T6 impact at 4.4 m/s')

axs[2].set_xlabel('Time (ms)')
axs[2].set_ylabel('Impact Force (kN)');

plt.xlim([0, t_lim]);
plt.ylim([0, 8]);
fig_ft.legend(loc='center left', bbox_to_anchor=(1, 0.5))
<matplotlib.legend.Legend at 0x1ca0815cca0>
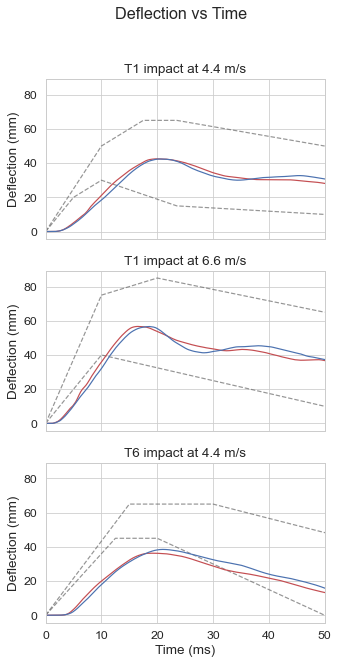
Deflection vs time#
Show code cell source
fig_dt, axs = plt.subplots(nrows=3, ncols=1, sharex=True, sharey=True,figsize=(5, 10))
fig_dt.suptitle('Deflection vs Time')

axs[0].plot(ex_deflection_time['Time-T1-4.4-lower (ms)'], ex_deflection_time['Deflection-T1-4.4-lower (mm)'],label="corridors from experiments", **plotExperiment)
axs[0].plot(ex_deflection_time['Time-T1-4.4-upper (ms)'], ex_deflection_time['Deflection-T1-4.4-upper (mm)'], **plotExperiment)
axs[0].plot(simData_50F_2.Bone.T8_COG_x.time, chest_deflection_50F_2 -chest_deflection_50F_2.iloc[0],  **plot50F)
axs[0].plot(simData_50M_2.Bone.T8_COG_x.time, chest_deflection_50M_2 -chest_deflection_50M_2.iloc[0], **plot50M)
axs[0].set_title('T1 impact at 4.4 m/s')
axs[0].set_ylabel('Deflection (mm)')

axs[1].plot(ex_deflection_time['Time-T1-6.6-lower (ms)'], ex_deflection_time['Deflection-T1-6.6-lower (mm)'], **plotExperiment)
axs[1].plot(ex_deflection_time['Time-T1-6.6-upper (ms)'], ex_deflection_time['Deflection-T1-6.6-upper (mm)'], **plotExperiment)
axs[1].plot(simData_50F_3.Bone.T8_COG_x.time, chest_deflection_50F_3 -chest_deflection_50F_3.iloc[0],  **plot50F)
axs[1].plot(simData_50M_3.Bone.T8_COG_x.time, chest_deflection_50M_3 -chest_deflection_50M_3.iloc[0], **plot50M)
axs[1].set_title('T1 impact at 6.6 m/s')
axs[1].set_ylabel('Deflection (mm)')

axs[2].plot(ex_deflection_time['Time-T6-lower (ms)'], ex_deflection_time['Deflection-T6-lower (mm)'], **plotExperiment)
axs[2].plot(ex_deflection_time['Time-T6-upper (ms)'], ex_deflection_time['Deflection-T6-upper (mm)'], **plotExperiment)
axs[2].plot(simData_50F.Bone.T8_COG_x.time, chest_deflection_50F -chest_deflection_50F.iloc[0],  **plot50F)
axs[2].plot(simData_50M.Bone.T8_COG_x.time, chest_deflection_50M -chest_deflection_50M.iloc[0], **plot50M)
axs[2].set_title('T6 impact at 4.4 m/s')
#axs[2].plot(plotData_T6['Bone:T8_center_x:time[ms]'], -(chest_deflection-chest_deflection[0]))

axs[2].set_xlabel('Time (ms)')
axs[2].set_ylabel('Deflection (mm)');

plt.xlim([0, t_lim]);