Lower leg (Ivarsson 2006)#
Validation model information#
Postprocessing of femur shaft validations based on Ivarsson et al. 2006
Performed by: Nico Erlinger, Elena Weißenbacher
Reviewed by: Corina Klug Added to VIVA+ Validation Catalog on: 2022-10-21
Version |
Date |
Performed by |
LS-Dyna |
|---|---|---|---|
0.3.2 |
2022-12-23 |
Nico Erlinger |
9.3.1 |
1.1.0 |
2024-05-16 |
Corina Klug |
9.3.1 |
Performed by: Elena Weissenbacher, Nico Erlinger
Reviewed by: Corina Klug
Added to VIVA+ Validation Catalog on: 2022-12-23
Last modified: 2023-11-23
Model version (this notebook run for): 0.3.2
© 2019-2024, OpenVT Organization (OVTO)
Available openly under under Creative Commons Attribution 4.0 International License 
Experiments by Ivarsson et al. (2006)#
#
Ivarsson, J.; Crandall, J.; Genovese, D.; Bose, D.; Bolton, J.; Provencher, J-A.; Erwin, M.; Manaswi, A.; Untariou, C. 2006. Development of a new tibia index. A Report Prepared for NHTSA, Cooperative Agreement No. DTNH22-01-H-07292.
Summary#
Four female tests were replicated.
Information on the subjects/specimens#
Test |
Sex |
Donor age [yr] |
Impact direction |
|---|---|---|---|
Tib 2-17 |
F |
43 |
posterior-anterior |
Tib 3-10 |
F |
42 |
anterior-posterior |
Tib 3-17 |
F |
57 |
anterior-posterior |
Tib 3-25 |
F |
38 |
anterior-posterior |
Loading and Boundary Conditions#
The displacement-time histories of the impactor were downloaded from the NHTSA Biomchanics Test Database (www.nhtsa.gov/research-data/research-testing-databases).
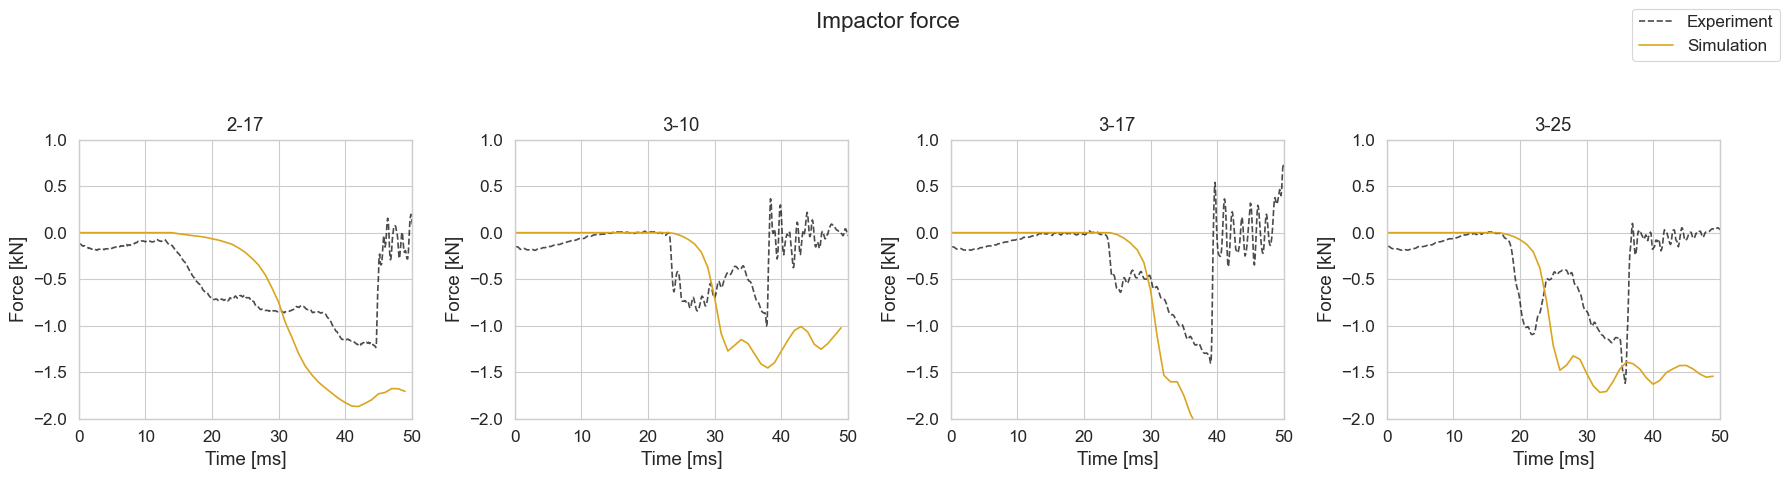
Experimental responses#
The force-time histories of the impactor were downloaded from the NHTSA Biomchanics Test Database (www.nhtsa.gov/research-data/research-testing-databases).
Other notes for simulation#
Impactor force plots#
Show code cell source
create_subplots(
figure_title = 'Impactor force',
sim_x_data = ('MODEL', 'Impactor_contact_Force_z', 'time'),
sim_y_data = ('MODEL', 'Impactor_contact_Force_z', 'force'),
sim_name1_legend = 'Simulation',
exp_x_data = ('time', 'ms'),
exp_y_data = ('force', 'kN'),
exp_name1_legend = 'Experiment',
x_label = ('Time [ms]'),
y_label = ('Force [kN]'),
x_lim = [0, 50],
y_lim = [-2, 1],
filename_save = 'results/figures/Ivarsson_2006_force_time.svg' )
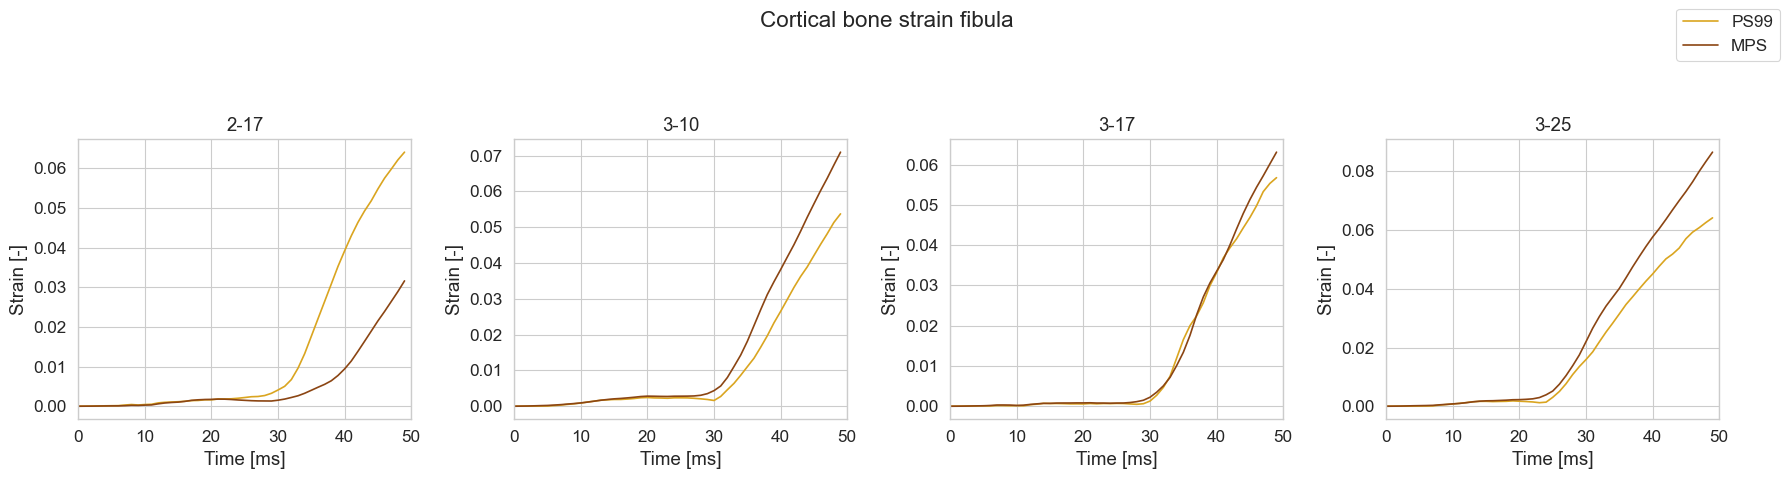
Plot strain-time histories#
Show code cell source
create_subplots(
figure_title = 'Cortical bone strain tibia',
sim_x_data = ('MODEL', 'Tibia_Cortical_R_PS99', 'time'),
sim_y_data = ('MODEL', 'Tibia_Cortical_R_PS99', 'strain'),
sim_x_data2 = ('MODEL', 'Tibia_Cortical_R_MPS', 'time'),
sim_y_data2 = ('MODEL', 'Tibia_Cortical_R_MPS', 'strain'),
sim_name1_legend = 'PS99',
sim_name2_legend = 'MPS',
x_label = 'Time [ms]',
y_label = 'Strain [-]',
x_lim = [0, 50],
filename_save = 'results/figures/Ivarsson_2006_tibia_strain_time.svg')

create_subplots(
figure_title = 'Cortical bone strain fibula',
sim_x_data = ('MODEL', 'Fibula_Cortical_R_PS99', 'time'),
sim_y_data = ('MODEL', 'Fibula_Cortical_R_PS99', 'strain'),
sim_x_data2 = ('MODEL', 'Fibula_Cortical_R_MPS', 'time'),
sim_y_data2 = ('MODEL', 'Fibula_Cortical_R_MPS', 'strain'),
sim_name1_legend = 'PS99',
sim_name2_legend = 'MPS',
x_label = 'Time [ms]',
y_label = 'Strain [-]',
x_lim = [0, 50],
filename_save = 'results/figures/Ivarsson_2006_Fibula_strain_time.svg')

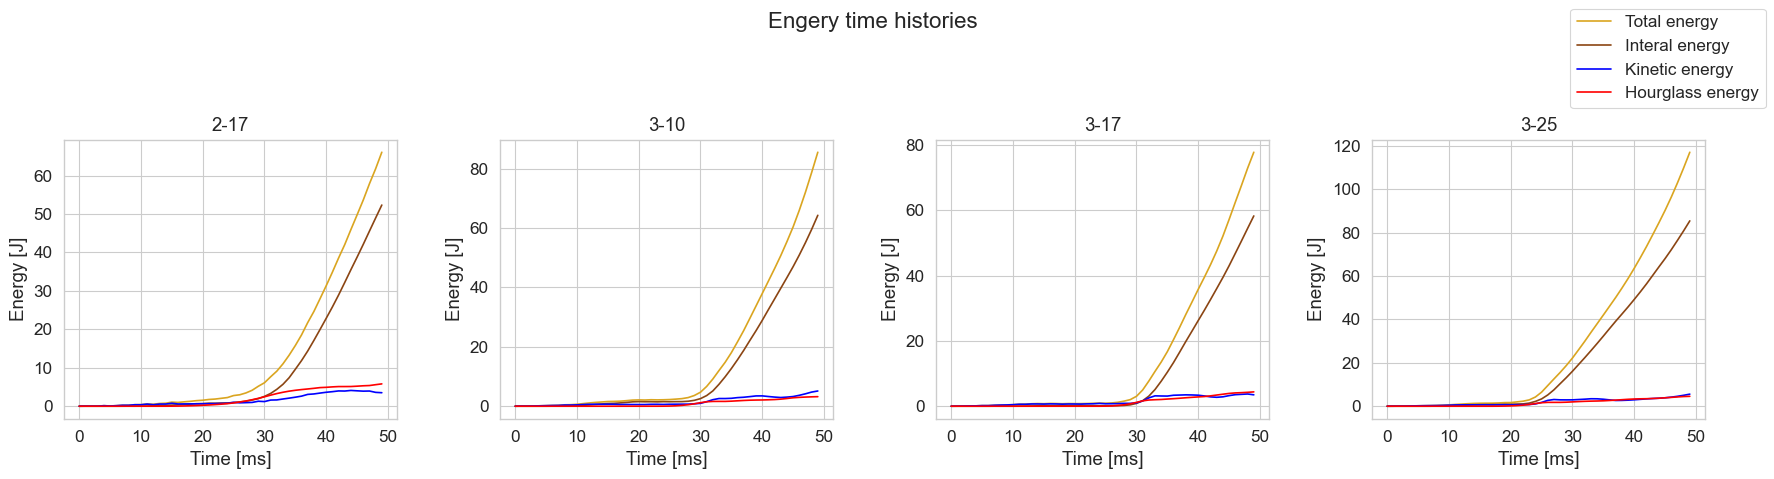
Engergy-time plots#
Show code cell source
create_subplots(
figure_title = 'Engery time histories',
sim_x_data = ('MODEL', 'Total_Energy', 'time'),
sim_y_data = ('MODEL', 'Total_Energy', 'energy'),
sim_x_data2 = ('MODEL', 'Internal_Energy', 'time'),
sim_y_data2 = ('MODEL', 'Internal_Energy', 'energy'),
sim_x_data3 = ('MODEL', 'Kinetic_Energy', 'time'),
sim_y_data3 = ('MODEL', 'Kinetic_Energy', 'energy'),
sim_x_data4 = ('MODEL', 'Hourglass_Energy', 'time'),
sim_y_data4 = ('MODEL', 'Hourglass_Energy', 'energy'),
sim_name1_legend = 'Total energy',
sim_name2_legend = 'Interal energy',
sim_name3_legend = 'Kinetic energy',
sim_name4_legend = 'Hourglass energy',
x_label = 'Time [ms]',
y_label = 'Energy [J]',
x_lim = [0, 50],
filename_save = 'results/figures/Ivarsson_2006_time_energy_histories.svg')