Lateral Impact (Viano 1989)#
Model validation information
Performed by : Corina Klug
Reviewed by : Jobin John
Added to VIVA+ Validation Catalog on 2022-06-28 by Corina Klug
Version |
Date |
Performed by |
LS-Dyna |
|---|---|---|---|
2022-06-28 |
Corina Klug |
9.3.1 |
|
0.3.2 |
2022-12-01 |
Corina Klug |
9.3.1 |
1.1.1 |
2024-05-22 |
Matej Kranjec |
12.2.1 |
© 2019-2024, OpenVT Organization (OVTO)
Available openly under under Creative Commons Attribution 4.0 International License 
Experiment by Viano et al. (1989)#
Summary:#
The simulated outputs are compared to the references from PMHS tests reported by Viano et al., 1989 1
1 Viano, D.C. (1989), “Biomechanical Responses and Injuries in Blunt Lateral Impact”, 33rd Stapp Car Crash Conference Proceedings, 4.10.1989, SAE International.
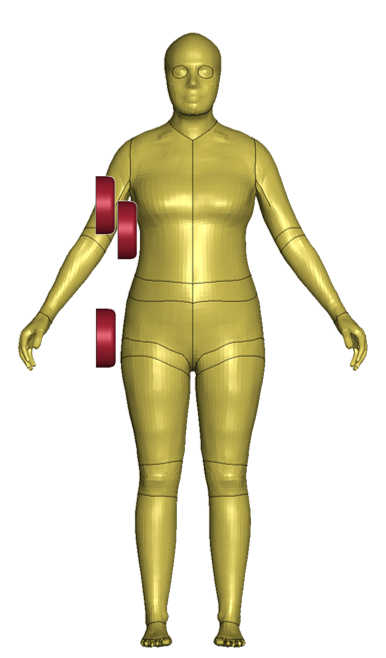
(figure shows aligned impactors for easier visualisation)
Experiment#
Information on the subjects/specimens#
3 female specimen (average age: 56 yrs, average mass: 57.8 kg, average height: 161.8 kg)
11 male specimen (average age: 53.2 yrs, average mass: 70.25 kg, average height: 173.4 cm)
Loading and Boundary Conditions#
Low-Speed (LS), Medium-Speed (MS) and High-Speed (HS) Impacts at the area of the hip, upper abdomen and thorax.
Impact#
Impact Location |
Midpoint of Impactor aligned with |
Impact angle |
LS |
MS |
HS |
|---|---|---|---|---|---|
Thoracic Impact |
Xiphoid process (XP) |
330° |
4.4 |
6.5 |
- |
Abdmoninal Impact |
7.5 cm below XP |
330° |
5.8 |
6.8 |
- |
Hip Impact |
Greater trochanter |
270° |
5.2 |
- |
9.8 |
Positioning#
The VIVA+ model is used in the default standing position. No contact is modelled between arms and impactors.
Responses recorded#
The reference values from the paper were digitalised and are incuded in the package. The data corresponds to the unnormalised corridors.
Other Notes for simulation#
Notes on implementation and iterations during the implementation of validation simulations
Variable declaration#
Postprocessing with dynasaur#
# Import dynasaur library
from dynasaur.plugins.data_visualization_controller import DataVisualizationController
from dynasaur.plugins.criteria_controller import CriteriaController
# write metadata
metadata={
  "date": date,
  "name": name,
  "n_cpu": n_cpu,
  "dyna_executable_name": dyna_executable_name,
  "platform": platform,
  "os_level": os_level
}

with open(os.path.join(processed_data_dir, simulation_meta_file_name), 'w+') as f:
  json.dump(metadata, f, indent=4)
Results#
Force-Deflection Plots#
Show code cell source
fig_ft_Hip, (ax1, ax2) = plt.subplots(nrows=2, ncols=1)
fig_ft_Hip.suptitle('Hip Impacts')

ax1.plot(-simData_50F_Hip_HS['IMPACTOR']['Disp_x']['displacement']-2, simData_50F_Hip_HS['IMPACTOR']['Contactforce_impactor_to_HBM_CFC_180']['force'], label = "VIVA+ 50F", **plot50F)
ax1.plot(-simData_50M_Hip_HS['IMPACTOR']['Disp_x']['displacement']-8, simData_50M_Hip_HS['IMPACTOR']['Contactforce_impactor_to_HBM_CFC_180']['force'], label = "VIVA+ 50M", **plot50M)
ax1.plot(Hip_Exp['Pelvis_HS:Deflection [cm]']*10, Hip_Exp['Pelvis_HS:Force_D [kN]'], label = "Experiment", **plotExperiment)
ax1.set(title="High Speed", ylabel="Force [kN]")
ax1.set_xlim(0,60)
ax1.set_ylim(0,15)

ax2.plot(-simData_50F_Hip_LS['IMPACTOR']['Disp_x']['displacement']-10, simData_50F_Hip_LS['IMPACTOR']['Contactforce_impactor_to_HBM_CFC_180']['force'],  **plot50F)
ax2.plot(-simData_50M_Hip_LS['IMPACTOR']['Disp_x']['displacement']-15, simData_50M_Hip_LS['IMPACTOR']['Contactforce_impactor_to_HBM_CFC_180']['force'],  **plot50M)
ax2.plot(Hip_Exp['Pelvis_LS:Deflection [cm]']*10, Hip_Exp['Pelvis_LS:Force_D [kN]'], **plotExperiment)
ax2.set(title="Low Speed", xlabel ="Deflection [mm]", ylabel="Force [kN]")
ax2.set_xlim(0,60)
ax2.set_ylim(0,15)

fig_ft_Hip.legend(loc='center left', bbox_to_anchor=(1, 0.5));
fig_ft_Hip.tight_layout(pad=0.5)

plt.show()

Show code cell source
fig_ft_Hip, (ax1, ax2) = plt.subplots(nrows=2, ncols=1)
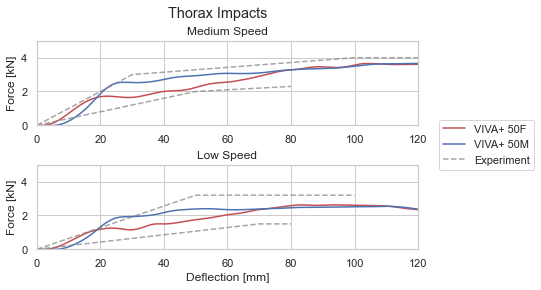
fig_ft_Hip.suptitle('Thorax Impacts')
ax1.plot(-simData_50F_Thorax_MS['IMPACTOR']['Disp_x']['displacement']-30, simData_50F_Thorax_MS['IMPACTOR']['Contactforce_impactor_to_HBM_CFC_180']['force'], label = "VIVA+ 50F", **plot50F)
ax1.plot(-simData_50M_Thorax_MS['IMPACTOR']['Disp_x']['displacement']-30, simData_50M_Thorax_MS['IMPACTOR']['Contactforce_impactor_to_HBM_CFC_180']['force'], label = "VIVA+ 50M", **plot50M)
ax1.plot(Thorax_Exp['Thorax_MS:Deflection [cm]']*10, Thorax_Exp['Thorax_MS:Force_D [kN]'], label = "Experiment", **plotExperiment)
ax1.set(title="Medium Speed", ylabel="Force [kN]")
ax1.set_xlim(0,120)
ax1.set_ylim(0,5)
ax2.plot(-simData_50F_Thorax_LS['IMPACTOR']['Disp_x']['displacement']-30, simData_50F_Thorax_LS['IMPACTOR']['Contactforce_impactor_to_HBM_CFC_180']['force'], **plot50F)
ax2.plot(-simData_50M_Thorax_LS['IMPACTOR']['Disp_x']['displacement']-30, simData_50M_Thorax_LS['IMPACTOR']['Contactforce_impactor_to_HBM_CFC_180']['force'], **plot50M)
ax2.plot(Thorax_Exp['Thorax_LS:Deflection [cm]']*10, Thorax_Exp['Thorax_LS:Force_D [kN]'], **plotExperiment)
ax2.set(title="Low Speed", xlabel ="Deflection [mm]", ylabel="Force [kN]")
ax2.set_xlim(0,120)
ax2.set_ylim(0,5)
fig_ft_Hip.legend(loc='center left', bbox_to_anchor=(1, 0.5));
fig_ft_Hip.tight_layout(pad=0.5)
plt.show()
Show code cell source
fig_ft_Abdomen, (ax1, ax2) = plt.subplots(nrows=2, ncols=1)
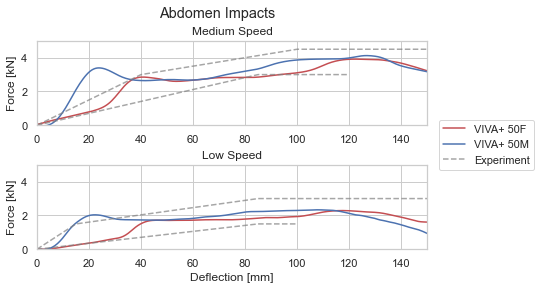
fig_ft_Abdomen.suptitle('Abdomen Impacts')
ax1.plot(-simData_50F_Abdomen_MS['IMPACTOR']['Disp_x']['displacement']-35, simData_50F_Abdomen_MS['IMPACTOR']['Contactforce_impactor_to_HBM_CFC_180']['force'], label = "VIVA+ 50F", **plot50F)
ax1.plot(-simData_50M_Abdomen_MS['IMPACTOR']['Disp_x']['displacement']-40, simData_50M_Abdomen_MS['IMPACTOR']['Contactforce_impactor_to_HBM_CFC_180']['force'], label = "VIVA+ 50M", **plot50M)
ax1.plot(Abdomen_Exp['Abdomen_MS:Deflection [cm]']*10, Abdomen_Exp['Abdomen_MS:Force_D [kN]'], label = "Experiment", **plotExperiment)
ax1.set(title="Medium Speed", ylabel="Force [kN]")
ax1.set_xlim(0,150)
ax1.set_ylim(0,5)
ax2.plot(-simData_50F_Abdomen_LS['IMPACTOR']['Disp_x']['displacement']-30, simData_50F_Abdomen_LS['IMPACTOR']['Contactforce_impactor_to_HBM_CFC_180']['force'], **plot50F)
ax2.plot(-simData_50M_Abdomen_LS['IMPACTOR']['Disp_x']['displacement']-42, simData_50M_Abdomen_LS['IMPACTOR']['Contactforce_impactor_to_HBM_CFC_180']['force'], **plot50M)
ax2.plot(Abdomen_Exp['Abdomen_LS:Deflection [cm]']*10, Abdomen_Exp['Abdomen_LS:Force_D [kN]'], **plotExperiment)
ax2.set(title="Low Speed", xlabel ="Deflection [mm]", ylabel="Force [kN]")
ax2.set_xlim(0,150)
ax2.set_ylim(0,5)
fig_ft_Abdomen.legend(loc='center left', bbox_to_anchor=(1, 0.5));
fig_ft_Abdomen.tight_layout(pad=0.5)
plt.show()
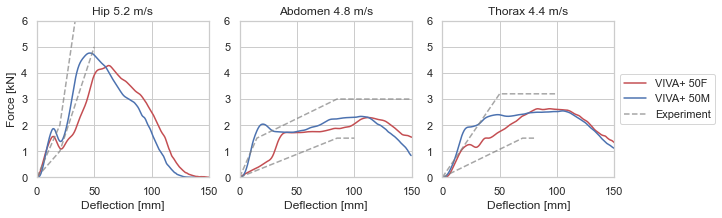
Summary of low-speed impacts#
Show code cell source
fig_fd_LS, (ax1, ax2, ax3) = plt.subplots(nrows=1, ncols=3, figsize=(10,3))

ax1.plot(-simData_50F_Hip_LS['IMPACTOR']['Disp_x']['displacement']-7, simData_50F_Hip_LS['IMPACTOR']['Contactforce_impactor_to_HBM_CFC_180']['force'], label = "VIVA+ 50F", **plot50F)
ax1.plot(-simData_50M_Hip_LS['IMPACTOR']['Disp_x']['displacement']-13, simData_50M_Hip_LS['IMPACTOR']['Contactforce_impactor_to_HBM_CFC_180']['force'],label = "VIVA+ 50M",  **plot50M)
ax1.plot(Hip_Exp['Pelvis_LS:Deflection [cm]']*10, Hip_Exp['Pelvis_LS:Force_D [kN]'], label = "Experiment", **plotExperiment)
ax1.set(title="Hip 5.2 m/s", xlabel ="Deflection [mm]", ylabel="Force [kN]")
ax1.set_xlim(0,150)
ax1.set_ylim(0,6)

ax2.plot(-simData_50F_Abdomen_LS['IMPACTOR']['Disp_x']['displacement']-35, simData_50F_Abdomen_LS['IMPACTOR']['Contactforce_impactor_to_HBM_CFC_180']['force'], label = "VIVA+ 50F", **plot50F)
ax2.plot(-simData_50M_Abdomen_LS['IMPACTOR']['Disp_x']['displacement']-44, simData_50M_Abdomen_LS['IMPACTOR']['Contactforce_impactor_to_HBM_CFC_180']['force'], label = "VIVA+ 50M", **plot50M)
ax2.plot(Abdomen_Exp['Abdomen_LS:Deflection [cm]']*10, Abdomen_Exp['Abdomen_LS:Force_D [kN]'], label = "Experiment", **plotExperiment)
ax2.set(title="Abdomen 4.8 m/s", xlabel ="Deflection [mm]")
ax2.set_xlim(0,150)
ax2.set_ylim(0,6)

ax3.plot(-simData_50F_Thorax_LS['IMPACTOR']['Disp_x']['displacement']-30, simData_50F_Thorax_LS['IMPACTOR']['Contactforce_impactor_to_HBM_CFC_180']['force'], label = "VIVA+ 50F", **plot50F)
ax3.plot(-simData_50M_Thorax_LS['IMPACTOR']['Disp_x']['displacement']-35, simData_50M_Thorax_LS['IMPACTOR']['Contactforce_impactor_to_HBM_CFC_180']['force'], label = "VIVA+ 50M", **plot50M)
ax3.plot(Thorax_Exp['Thorax_LS:Deflection [cm]']*10, Thorax_Exp['Thorax_LS:Force_D [kN]'], label = "Experiment", **plotExperiment)
ax3.set(title="Thorax 4.4 m/s", xlabel ="Deflection [mm]")
ax3.set_xlim(0,150)
ax3.set_ylim(0,6)

ax3.legend(loc='center left', bbox_to_anchor=(1, 0.5));
fig_fd_LS.tight_layout(pad=0.5)
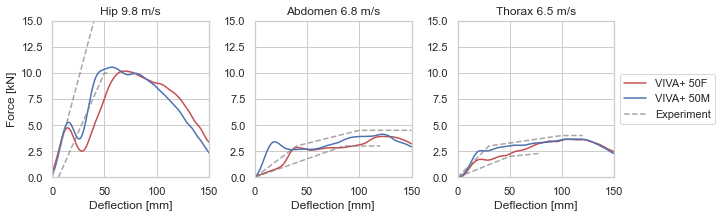
Summary of high- and mid-speed impacts#
Show code cell source
fig_fd_MS, (ax1, ax2, ax3) = plt.subplots(nrows=1, ncols=3, figsize=(10,3))

ax1.plot(-simData_50F_Hip_HS['IMPACTOR']['Disp_x']['displacement']-7, simData_50F_Hip_HS['IMPACTOR']['Contactforce_impactor_to_HBM_CFC_180']['force'], label = "VIVA+ 50F", **plot50F)
ax1.plot(-simData_50M_Hip_HS['IMPACTOR']['Disp_x']['displacement']-13, simData_50M_Hip_HS['IMPACTOR']['Contactforce_impactor_to_HBM_CFC_180']['force'],label = "VIVA+ 50M",  **plot50M)
ax1.plot(Hip_Exp['Pelvis_HS:Deflection [cm]']*10, Hip_Exp['Pelvis_HS:Force_D [kN]'], label = "Experiment", **plotExperiment)
ax1.set(title="Hip 9.8 m/s", xlabel ="Deflection [mm]", ylabel="Force [kN]")
ax1.set_xlim(0,150)
ax1.set_ylim(0,15)

ax2.plot(-simData_50F_Abdomen_MS['IMPACTOR']['Disp_x']['displacement']-35, simData_50F_Abdomen_MS['IMPACTOR']['Contactforce_impactor_to_HBM_CFC_180']['force'], label = "VIVA+ 50F", **plot50F)
ax2.plot(-simData_50M_Abdomen_MS['IMPACTOR']['Disp_x']['displacement']-45, simData_50M_Abdomen_MS['IMPACTOR']['Contactforce_impactor_to_HBM_CFC_180']['force'], label = "VIVA+ 50M", **plot50M)
ax2.plot(Abdomen_Exp['Abdomen_MS:Deflection [cm]']*10, Abdomen_Exp['Abdomen_MS:Force_D [kN]'], label = "Experiment", **plotExperiment)
ax2.set(title="Abdomen 6.8 m/s", xlabel ="Deflection [mm]")
ax2.set_xlim(0,150)
ax2.set_ylim(0,15)

ax3.plot(-simData_50F_Thorax_MS['IMPACTOR']['Disp_x']['displacement']-30, simData_50F_Thorax_MS['IMPACTOR']['Contactforce_impactor_to_HBM_CFC_180']['force'], label = "VIVA+ 50F", **plot50F)
ax3.plot(-simData_50M_Thorax_MS['IMPACTOR']['Disp_x']['displacement']-35, simData_50M_Thorax_MS['IMPACTOR']['Contactforce_impactor_to_HBM_CFC_180']['force'], label = "VIVA+ 50M", **plot50M)
ax3.plot(Thorax_Exp['Thorax_MS:Deflection [cm]']*10, Thorax_Exp['Thorax_MS:Force_D [kN]'], label = "Experiment", **plotExperiment)
ax3.set(title="Thorax 6.5 m/s", xlabel ="Deflection [mm]")
ax3.set_xlim(0,150)
ax3.set_ylim(0,15)

ax3.legend(loc='center left', bbox_to_anchor=(1, 0.5));
fig_fd_MS.tight_layout(pad=0.5)
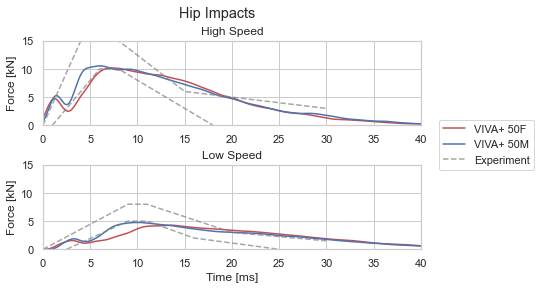
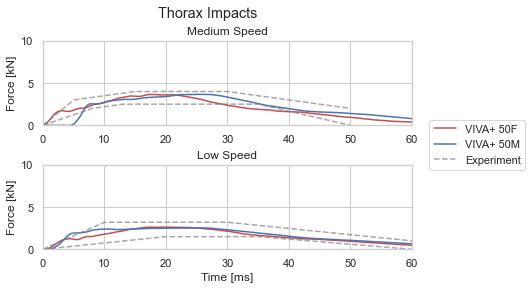
Force-time histories#
Show code cell source
fig_ft_Hip, (ax1, ax2) = plt.subplots(nrows=2, ncols=1)
fig_ft_Hip.suptitle('Hip Impacts')

ax1.plot(simData_50F_Hip_HS['IMPACTOR']['Contactforce_impactor_to_HBM_CFC_600']['time']-1, simData_50F_Hip_HS['IMPACTOR']['Contactforce_impactor_to_HBM_CFC_180']['force'], label = "VIVA+ 50F", **plot50F)
ax1.plot(simData_50M_Hip_HS['IMPACTOR']['Contactforce_impactor_to_HBM_CFC_600']['time']-1.5, simData_50M_Hip_HS['IMPACTOR']['Contactforce_impactor_to_HBM_CFC_180']['force'], label = "VIVA+ 50M", **plot50M)
ax1.plot(Hip_Exp['Pelvis_HS:Time [ms]'], Hip_Exp['Pelvis_HS:Force [kN]'], label = "Experiment", **plotExperiment)
ax1.set(title="High Speed", ylabel="Force [kN]")
ax1.set_xlim(0,40)
ax1.set_ylim(0,15)

ax2.plot(simData_50F_Hip_LS['IMPACTOR']['Contactforce_impactor_to_HBM_CFC_600']['time']-1, simData_50F_Hip_LS['IMPACTOR']['Contactforce_impactor_to_HBM_CFC_180']['force'],  **plot50F)
ax2.plot(simData_50M_Hip_LS['IMPACTOR']['Contactforce_impactor_to_HBM_CFC_600']['time']-2, simData_50M_Hip_LS['IMPACTOR']['Contactforce_impactor_to_HBM_CFC_180']['force'],  **plot50M)
ax2.plot(Hip_Exp['Pelvis_LS:Time [ms]'], Hip_Exp['Pelvis_LS:Force [kN]'], **plotExperiment)
ax2.set(title="Low Speed", xlabel ="Time [ms]", ylabel="Force [kN]")
ax2.set_xlim(0,40)
ax2.set_ylim(0,15)


fig_ft_Hip.legend(loc='center left', bbox_to_anchor=(1, 0.5));
fig_ft_Hip.tight_layout(pad=0.5)

plt.show()
Show code cell source
fig_ft_Thorax, (ax1, ax2) = plt.subplots(nrows=2, ncols=1)
fig_ft_Thorax.suptitle('Thorax Impacts')

ax1.plot(simData_50F_Thorax_MS['IMPACTOR']['Contactforce_impactor_to_HBM_CFC_180']['time']-5, simData_50F_Thorax_MS['IMPACTOR']['Contactforce_impactor_to_HBM_CFC_180']['force'], label = "VIVA+ 50F", **plot50F)
ax1.plot(simData_50M_Thorax_MS['IMPACTOR']['Contactforce_impactor_to_HBM_CFC_180']['time']-1, simData_50M_Thorax_MS['IMPACTOR']['Contactforce_impactor_to_HBM_CFC_180']['force'], label = "VIVA+ 50M", **plot50M)
ax1.plot(Thorax_Exp['Thorax_MS:Time [ms]'], Thorax_Exp['Thorax_MS:Force [kN]'], label = "Experiment", **plotExperiment)
ax1.set(title="Medium Speed", ylabel="Force [kN]")
ax1.set_xlim(0,60)
ax1.set_ylim(0,10)

ax2.plot(simData_50F_Thorax_LS['IMPACTOR']['Contactforce_impactor_to_HBM_CFC_180']['time']-6, simData_50F_Thorax_LS['IMPACTOR']['Contactforce_impactor_to_HBM_CFC_180']['force'],  **plot50F)
ax2.plot(simData_50M_Thorax_LS['IMPACTOR']['Contactforce_impactor_to_HBM_CFC_180']['time']-6, simData_50M_Thorax_LS['IMPACTOR']['Contactforce_impactor_to_HBM_CFC_180']['force'],  **plot50M)
ax2.plot(Thorax_Exp['Thorax_LS:Time [ms]'], Thorax_Exp['Thorax_LS:Force [kN]'], **plotExperiment)
ax2.set(title="Low Speed", xlabel ="Time [ms]", ylabel="Force [kN]")
ax2.set_xlim(0,60)
ax2.set_ylim(0,10)


fig_ft_Thorax.legend(loc='center left', bbox_to_anchor=(1, 0.5));
fig_ft_Thorax.tight_layout(pad=0.5)

plt.show()
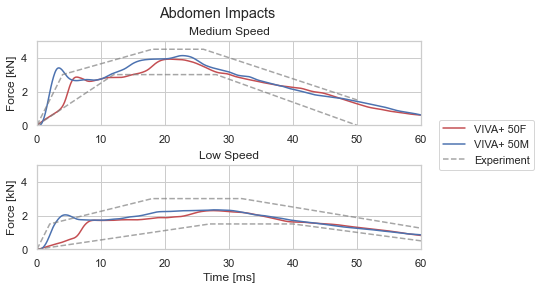
Show code cell source
fig_ft_Abdomen, (ax1, ax2) = plt.subplots(nrows=2, ncols=1)
fig_ft_Abdomen.suptitle('Abdomen Impacts')

ax1.plot(simData_50F_Abdomen_MS['IMPACTOR']['Contactforce_impactor_to_HBM_CFC_180']['time']-5, simData_50F_Abdomen_MS['IMPACTOR']['Contactforce_impactor_to_HBM_CFC_180']['force'], label = "VIVA+ 50F", **plot50F)
ax1.plot(simData_50M_Abdomen_MS['IMPACTOR']['Contactforce_impactor_to_HBM_CFC_180']['time']-6, simData_50M_Abdomen_MS['IMPACTOR']['Contactforce_impactor_to_HBM_CFC_180']['force'], label = "VIVA+ 50M", **plot50M)
ax1.plot(Abdomen_Exp['Abdomen_MS:Time [ms]'], Abdomen_Exp['Abdomen_MS:Force [kN]'], label = "Experiment", **plotExperiment)
ax1.set(title="Medium Speed", ylabel="Force [kN]")
ax1.set_xlim(0,60)
ax1.set_ylim(0,5)

ax2.plot(simData_50F_Abdomen_LS['IMPACTOR']['Contactforce_impactor_to_HBM_CFC_180']['time']-7, simData_50F_Abdomen_LS['IMPACTOR']['Contactforce_impactor_to_HBM_CFC_180']['force'],  **plot50F)
ax2.plot(simData_50M_Abdomen_LS['IMPACTOR']['Contactforce_impactor_to_HBM_CFC_180']['time']-9, simData_50M_Abdomen_LS['IMPACTOR']['Contactforce_impactor_to_HBM_CFC_180']['force'],  **plot50M)
ax2.plot(Abdomen_Exp['Abdomen_LS:Time [ms]'], Abdomen_Exp['Abdomen_LS:Force [kN]'], **plotExperiment)
ax2.set(title="Low Speed", xlabel ="Time [ms]", ylabel="Force [kN]")
ax2.set_xlim(0,60)
ax2.set_ylim(0,5)

fig_ft_Abdomen.legend(loc='center left', bbox_to_anchor=(1, 0.5));
fig_ft_Abdomen.tight_layout(pad=0.5)

plt.show()
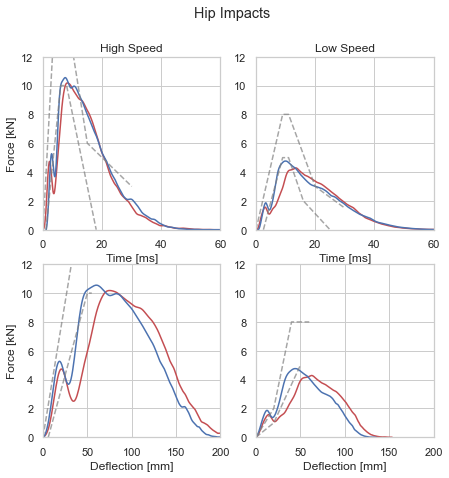
Show code cell source
fig_Hip, ((ax1, ax2), (ax3, ax4)) = plt.subplots(nrows=2, ncols=2, figsize=(7,7))
fig_Hip.suptitle('Hip Impacts')

ax1.plot(simData_50F_Hip_HS['IMPACTOR']['Contactforce_impactor_to_HBM_CFC_180']['time'], simData_50F_Hip_HS['IMPACTOR']['Contactforce_impactor_to_HBM_CFC_180']['force'], label = "VIVA+ 50F", **plot50F)
ax1.plot(simData_50M_Hip_HS['IMPACTOR']['Contactforce_impactor_to_HBM_CFC_180']['time'], simData_50M_Hip_HS['IMPACTOR']['Contactforce_impactor_to_HBM_CFC_180']['force'], label = "VIVA+ 50M", **plot50M)
ax1.plot(Hip_Exp['Pelvis_HS:Time [ms]'], Hip_Exp['Pelvis_HS:Force [kN]'], label = "Experiment", **plotExperiment)
ax1.set(title="High Speed", ylabel="Force [kN]", xlabel ="Time [ms]")
ax1.set_xlim(0,60)
ax1.set_ylim(0,12)

ax2.plot(simData_50F_Hip_LS['IMPACTOR']['Contactforce_impactor_to_HBM_CFC_180']['time']-1, simData_50F_Hip_LS['IMPACTOR']['Contactforce_impactor_to_HBM_CFC_180']['force'],  **plot50F)
ax2.plot(simData_50M_Hip_LS['IMPACTOR']['Contactforce_impactor_to_HBM_CFC_180']['time']-2, simData_50M_Hip_LS['IMPACTOR']['Contactforce_impactor_to_HBM_CFC_180']['force'],  **plot50M)
ax2.plot(Hip_Exp['Pelvis_LS:Time [ms]'], Hip_Exp['Pelvis_LS:Force [kN]'], **plotExperiment)
ax2.set(title="Low Speed", xlabel ="Time [ms]")
ax2.set_xlim(0,60)
ax2.set_ylim(0,12)

ax3.plot(-simData_50F_Hip_HS['IMPACTOR']['Disp_x']['displacement']-1, simData_50F_Hip_HS['IMPACTOR']['Contactforce_impactor_to_HBM_CFC_180']['force'], label = "VIVA+ 50F", **plot50F)
ax3.plot(-simData_50M_Hip_HS['IMPACTOR']['Disp_x']['displacement']-10, simData_50M_Hip_HS['IMPACTOR']['Contactforce_impactor_to_HBM_CFC_180']['force'], label = "VIVA+ 50M", **plot50M)
ax3.plot(Hip_Exp['Pelvis_HS:Deflection [cm]']*10, Hip_Exp['Pelvis_HS:Force_D [kN]'], label = "Experiment", **plotExperiment)
ax3.set( xlabel ="Deflection [mm]", ylabel="Force [kN]")
ax3.set_xlim(0,200)
ax3.set_ylim(0,12)

ax4.plot(-simData_50F_Hip_LS['IMPACTOR']['Disp_x']['displacement']-7, simData_50F_Hip_LS['IMPACTOR']['Contactforce_impactor_to_HBM_CFC_180']['force'],  **plot50F)
ax4.plot(-simData_50M_Hip_LS['IMPACTOR']['Disp_x']['displacement']-15, simData_50M_Hip_LS['IMPACTOR']['Contactforce_impactor_to_HBM_CFC_180']['force'],  **plot50M)
ax4.plot(Hip_Exp['Pelvis_LS:Deflection [cm]']*10, Hip_Exp['Pelvis_LS:Force_D [kN]'], **plotExperiment)
ax4.set( xlabel ="Deflection [mm]")
ax4.set_xlim(0,200)
ax4.set_ylim(0,12)

fig_ft_Hip.legend(loc='center left', bbox_to_anchor=(1, 0.5));
#fig_ft_Hip.tight_layout(pad=0.99)

plt.show()
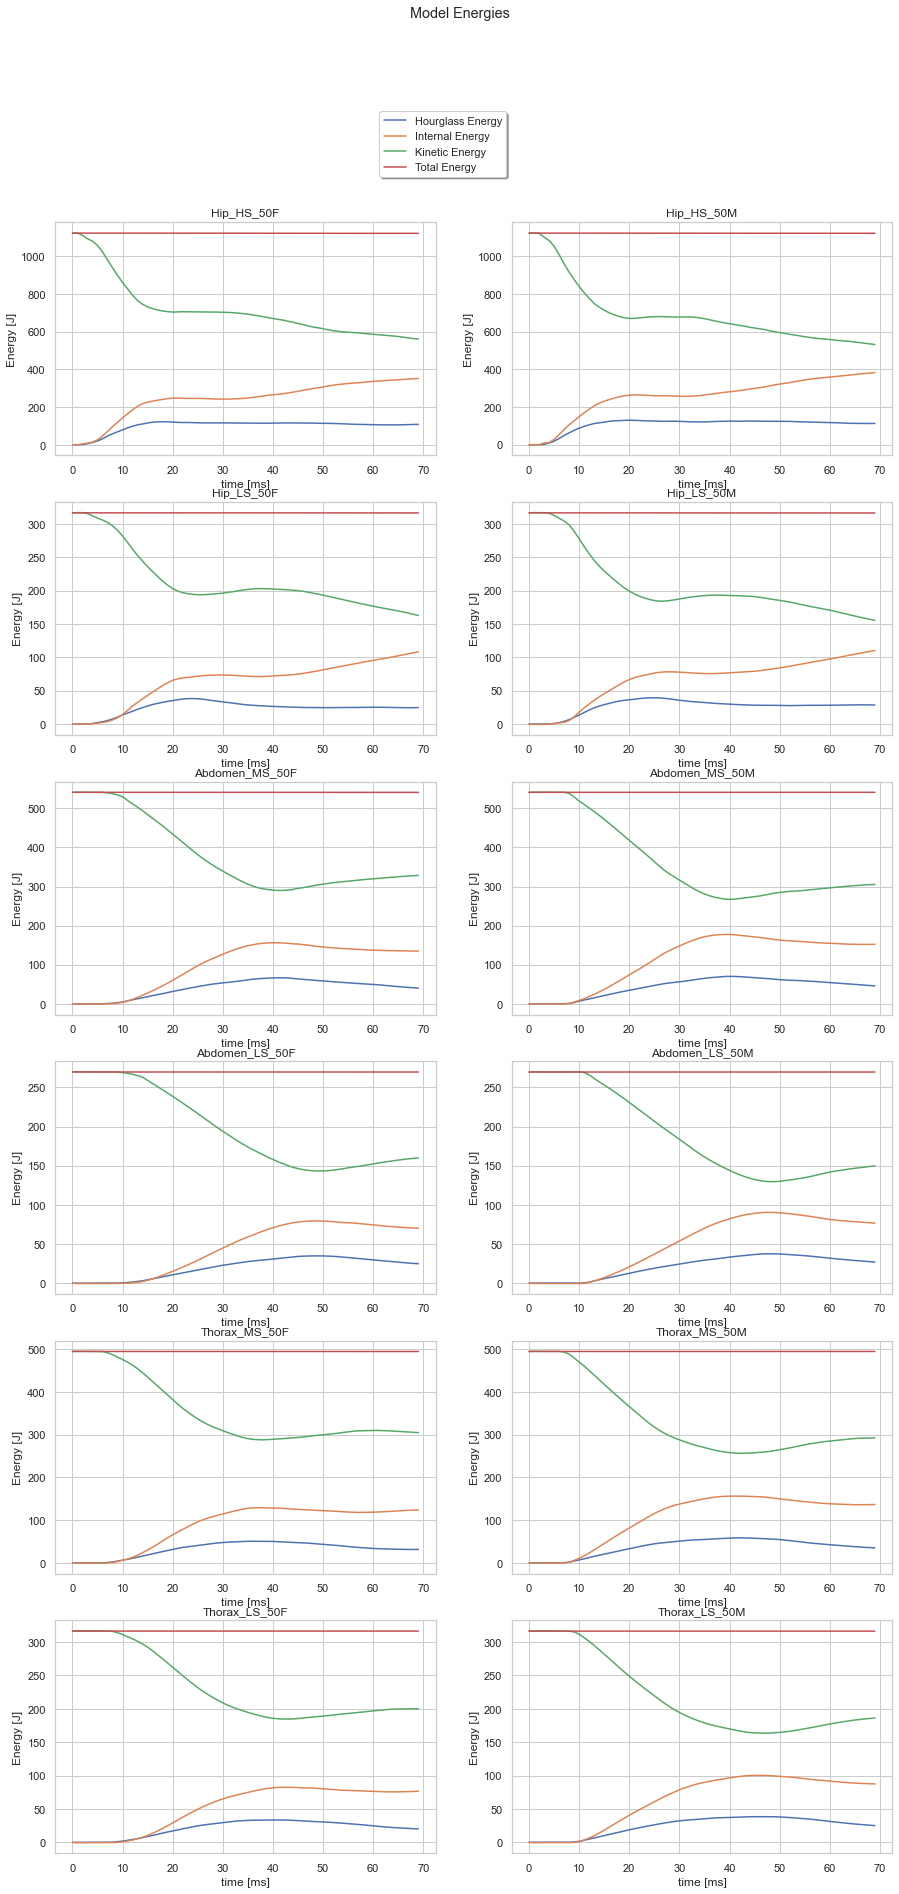
Energies#
Show code cell source
fig_energy, ((ax1F, ax1M), (ax2F, ax2M),(ax3F, ax3M),(ax4F, ax4M),(ax5F, ax5M),(ax6F, ax6M)) = plt.subplots(nrows=6, ncols=2, figsize=(15,30))
fig_energy.suptitle('Model Energies')
#plt.set_title('Simulation #1')
#plt.set_ylabel('Energies (J)')
i="1"
figure=ax1

LC=Loadcases[0]

ax1F.plot(simData_50F_Hip_HS.MODEL.Hourglass_Energy.time, simData_50F_Hip_HS.MODEL.Hourglass_Energy.energy, label = "Hourglass Energy")
ax1F.plot(simData_50F_Hip_HS.MODEL.Internal_Energy.time, simData_50F_Hip_HS.MODEL.Internal_Energy.energy, label = "Internal Energy")
ax1F.plot(simData_50F_Hip_HS.MODEL.Kinetic_Energy.time, simData_50F_Hip_HS.MODEL.Kinetic_Energy.energy, label = "Kinetic Energy")
ax1F.plot(simData_50F_Hip_HS.MODEL.Total_Energy.time, simData_50F_Hip_HS.MODEL.Total_Energy.energy, label = "Total Energy")
ax1F.set(title=LC + "_50F", xlabel ="time [ms]", ylabel="Energy [J]")

ax1M.plot(simData_50M_Hip_HS.MODEL.Hourglass_Energy.time, simData_50M_Hip_HS.MODEL.Hourglass_Energy.energy, label = "Hourglass Energy")
ax1M.plot(simData_50M_Hip_HS.MODEL.Internal_Energy.time, simData_50M_Hip_HS.MODEL.Internal_Energy.energy, label = "Internal Energy")
ax1M.plot(simData_50M_Hip_HS.MODEL.Kinetic_Energy.time, simData_50M_Hip_HS.MODEL.Kinetic_Energy.energy, label = "Kinetic Energy")
ax1M.plot(simData_50M_Hip_HS.MODEL.Total_Energy.time, simData_50M_Hip_HS.MODEL.Total_Energy.energy, label = "Total Energy")
ax1M.set(title=LC + "_50M", xlabel ="time [ms]", ylabel="Energy [J]")

LC=Loadcases[1]
ax2F.plot(simData_50F_Hip_LS.MODEL.Hourglass_Energy.time, simData_50F_Hip_LS.MODEL.Hourglass_Energy.energy, label = "Hourglass Energy")
ax2F.plot(simData_50F_Hip_LS.MODEL.Internal_Energy.time, simData_50F_Hip_LS.MODEL.Internal_Energy.energy, label = "Internal Energy")
ax2F.plot(simData_50F_Hip_LS.MODEL.Kinetic_Energy.time, simData_50F_Hip_LS.MODEL.Kinetic_Energy.energy, label = "Kinetic Energy")
ax2F.plot(simData_50F_Hip_LS.MODEL.Total_Energy.time, simData_50F_Hip_LS.MODEL.Total_Energy.energy, label = "Total Energy")
ax2F.set(title=LC + "_50F", xlabel ="time [ms]", ylabel="Energy [J]")

ax2M.plot(simData_50M_Hip_LS.MODEL.Hourglass_Energy.time, simData_50M_Hip_LS.MODEL.Hourglass_Energy.energy, label = "Hourglass Energy")
ax2M.plot(simData_50M_Hip_LS.MODEL.Internal_Energy.time, simData_50M_Hip_LS.MODEL.Internal_Energy.energy, label = "Internal Energy")
ax2M.plot(simData_50M_Hip_LS.MODEL.Kinetic_Energy.time, simData_50M_Hip_LS.MODEL.Kinetic_Energy.energy, label = "Kinetic Energy")
ax2M.plot(simData_50M_Hip_LS.MODEL.Total_Energy.time, simData_50M_Hip_LS.MODEL.Total_Energy.energy, label = "Total Energy")
ax2M.set(title=LC + "_50M", xlabel ="time [ms]", ylabel="Energy [J]")

LC=Loadcases[2]
ax3F.plot(simData_50F_Abdomen_MS.MODEL.Hourglass_Energy.time, simData_50F_Abdomen_MS.MODEL.Hourglass_Energy.energy, label = "Hourglass Energy")
ax3F.plot(simData_50F_Abdomen_MS.MODEL.Internal_Energy.time, simData_50F_Abdomen_MS.MODEL.Internal_Energy.energy, label = "Internal Energy")
ax3F.plot(simData_50F_Abdomen_MS.MODEL.Kinetic_Energy.time, simData_50F_Abdomen_MS.MODEL.Kinetic_Energy.energy, label = "Kinetic Energy")
ax3F.plot(simData_50F_Abdomen_MS.MODEL.Total_Energy.time, simData_50F_Abdomen_MS.MODEL.Total_Energy.energy, label = "Total Energy")
ax3F.set(title=LC + "_50F", xlabel ="time [ms]", ylabel="Energy [J]")

ax3M.plot(simData_50M_Abdomen_MS.MODEL.Hourglass_Energy.time, simData_50M_Abdomen_MS.MODEL.Hourglass_Energy.energy, label = "Hourglass Energy")
ax3M.plot(simData_50M_Abdomen_MS.MODEL.Internal_Energy.time, simData_50M_Abdomen_MS.MODEL.Internal_Energy.energy, label = "Internal Energy")
ax3M.plot(simData_50M_Abdomen_MS.MODEL.Kinetic_Energy.time, simData_50M_Abdomen_MS.MODEL.Kinetic_Energy.energy, label = "Kinetic Energy")
ax3M.plot(simData_50M_Abdomen_MS.MODEL.Total_Energy.time, simData_50M_Abdomen_MS.MODEL.Total_Energy.energy, label = "Total Energy")
ax3M.set(title=LC + "_50M", xlabel ="time [ms]", ylabel="Energy [J]")

LC=Loadcases[3]
ax4F.plot(simData_50F_Abdomen_LS.MODEL.Hourglass_Energy.time, simData_50F_Abdomen_LS.MODEL.Hourglass_Energy.energy, label = "Hourglass Energy")
ax4F.plot(simData_50F_Abdomen_LS.MODEL.Internal_Energy.time, simData_50F_Abdomen_LS.MODEL.Internal_Energy.energy, label = "Internal Energy")
ax4F.plot(simData_50F_Abdomen_LS.MODEL.Kinetic_Energy.time, simData_50F_Abdomen_LS.MODEL.Kinetic_Energy.energy, label = "Kinetic Energy")
ax4F.plot(simData_50F_Abdomen_LS.MODEL.Total_Energy.time, simData_50F_Abdomen_LS.MODEL.Total_Energy.energy, label = "Total Energy")
ax4F.set(title=LC + "_50F", xlabel ="time [ms]", ylabel="Energy [J]")

ax4M.plot(simData_50M_Abdomen_LS.MODEL.Hourglass_Energy.time, simData_50M_Abdomen_LS.MODEL.Hourglass_Energy.energy, label = "Hourglass Energy")
ax4M.plot(simData_50M_Abdomen_LS.MODEL.Internal_Energy.time, simData_50M_Abdomen_LS.MODEL.Internal_Energy.energy, label = "Internal Energy")
ax4M.plot(simData_50M_Abdomen_LS.MODEL.Kinetic_Energy.time, simData_50M_Abdomen_LS.MODEL.Kinetic_Energy.energy, label = "Kinetic Energy")
ax4M.plot(simData_50M_Abdomen_LS.MODEL.Total_Energy.time, simData_50M_Abdomen_LS.MODEL.Total_Energy.energy, label = "Total Energy")
ax4M.set(title=LC + "_50M", xlabel ="time [ms]", ylabel="Energy [J]")

LC=Loadcases[4]
ax5F.plot(simData_50F_Thorax_MS.MODEL.Hourglass_Energy.time, simData_50F_Thorax_MS.MODEL.Hourglass_Energy.energy, label = "Hourglass Energy")
ax5F.plot(simData_50F_Thorax_MS.MODEL.Internal_Energy.time, simData_50F_Thorax_MS.MODEL.Internal_Energy.energy, label = "Internal Energy")
ax5F.plot(simData_50F_Thorax_MS.MODEL.Kinetic_Energy.time, simData_50F_Thorax_MS.MODEL.Kinetic_Energy.energy, label = "Kinetic Energy")
ax5F.plot(simData_50F_Thorax_MS.MODEL.Total_Energy.time, simData_50F_Thorax_MS.MODEL.Total_Energy.energy, label = "Total Energy")
ax5F.set(title=LC + "_50F", xlabel ="time [ms]", ylabel="Energy [J]")

ax5M.plot(simData_50M_Thorax_MS.MODEL.Hourglass_Energy.time, simData_50M_Thorax_MS.MODEL.Hourglass_Energy.energy, label = "Hourglass Energy")
ax5M.plot(simData_50M_Thorax_MS.MODEL.Internal_Energy.time, simData_50M_Thorax_MS.MODEL.Internal_Energy.energy, label = "Internal Energy")
ax5M.plot(simData_50M_Thorax_MS.MODEL.Kinetic_Energy.time, simData_50M_Thorax_MS.MODEL.Kinetic_Energy.energy, label = "Kinetic Energy")
ax5M.plot(simData_50M_Thorax_MS.MODEL.Total_Energy.time, simData_50M_Thorax_MS.MODEL.Total_Energy.energy, label = "Total Energy")
ax5M.set(title=LC + "_50M", xlabel ="time [ms]", ylabel="Energy [J]")

LC=Loadcases[5]
ax6F.plot(simData_50F_Thorax_LS.MODEL.Hourglass_Energy.time, simData_50F_Thorax_LS.MODEL.Hourglass_Energy.energy, label = "Hourglass Energy")
ax6F.plot(simData_50F_Thorax_LS.MODEL.Internal_Energy.time, simData_50F_Thorax_LS.MODEL.Internal_Energy.energy, label = "Internal Energy")
ax6F.plot(simData_50F_Thorax_LS.MODEL.Kinetic_Energy.time, simData_50F_Thorax_LS.MODEL.Kinetic_Energy.energy, label = "Kinetic Energy")
ax6F.plot(simData_50F_Thorax_LS.MODEL.Total_Energy.time, simData_50F_Thorax_LS.MODEL.Total_Energy.energy, label = "Total Energy")
ax6F.set(title=LC + "_50F", xlabel ="time [ms]", ylabel="Energy [J]")

ax6M.plot(simData_50M_Thorax_LS.MODEL.Hourglass_Energy.time, simData_50M_Thorax_LS.MODEL.Hourglass_Energy.energy, label = "Hourglass Energy")
ax6M.plot(simData_50M_Thorax_LS.MODEL.Internal_Energy.time, simData_50M_Thorax_LS.MODEL.Internal_Energy.energy, label = "Internal Energy")
ax6M.plot(simData_50M_Thorax_LS.MODEL.Kinetic_Energy.time, simData_50M_Thorax_LS.MODEL.Kinetic_Energy.energy, label = "Kinetic Energy")
ax6M.plot(simData_50M_Thorax_LS.MODEL.Total_Energy.time, simData_50M_Thorax_LS.MODEL.Total_Energy.energy, label = "Total Energy")
ax6M.set(title=LC + "_50M", xlabel ="time [ms]", ylabel="Energy [J]")


plt.legend(loc='best', bbox_to_anchor=(0, 7.5),
          fancybox=True, shadow=True);

#plt.tight_layout(pad=0.5)