Shoulder impact (Compigne 2004)#
Postprocessing of Hub Impacts based on Compigne et al., 2004
Version |
Date |
Performed by |
LS-Dyna |
|---|---|---|---|
0.3.2 |
2022-06-28 |
Jobin John |
9.3.1 |
1.1.0 |
2024-05-22 |
Jobin John |
12.2.1 |
Added to VIVA+ Validation Catalog on 2022-06-28 by Jobin John
© 2019-2024, OpenVT Organization (OVTO)
Available openly under Creative Commons Attribution 4.0 International License 
Experiment by Compigne et al. 2004#
This loadcase simulates the shoulder impacts reported by Compigne et al., 2004
Compigne, S., Caire, Y., Quesnel, T., & Verries, J. P. (2004). Non-injurious and injurious impact response of the human shoulder three-dimensional analysis of kinematics and determination of injury threshold (No. 2004-22-0005). SAE Technical Paper.
Experiment#
Seven post-mortem human subjects (PMHS) were struck on the shoulders with a 23.4 kg rectangular impactor.
Information on subjects#
Subject |
Age |
Sex |
Weight (kg) |
Height (cm) |
Shoulder width (mm) |
Flesh thickness L/R (mm) |
|---|---|---|---|---|---|---|
1 |
77 |
F |
67 |
161 |
335 |
20/24 |
2 |
88 |
M |
33 |
163 |
355 |
10/12 |
3 |
79 |
F |
52 |
159 |
355 |
12/10 |
4 |
82 |
F |
50 |
155 |
345 |
15/15 |
5 |
91 |
M |
50 |
165 |
370 |
13/12 |
6 |
94 |
F |
50 |
148 |
355 |
11/13 |
7 |
93 |
F |
66.5 |
152 |
400 |
20/30 |
Loading and Boundary Conditions#
In this experiment, the subjects were impacted on the right shoulder at low speed (1.5 m/s) and at high speed (3 - 6 m/s) on the left shoulder. For the low speed impact, the impact direction was also varied in between \(+15^o\) and \(-15^o\).
Simulation#
In the simulations presented below, the 50F and 50M VIVA+ seated models were impacted at
low speed of 1.5 m/s
high speed of 6 m/s.
The acromion-to-acromion deflection was compared to the raw (unscaled) responses reported in the publication.

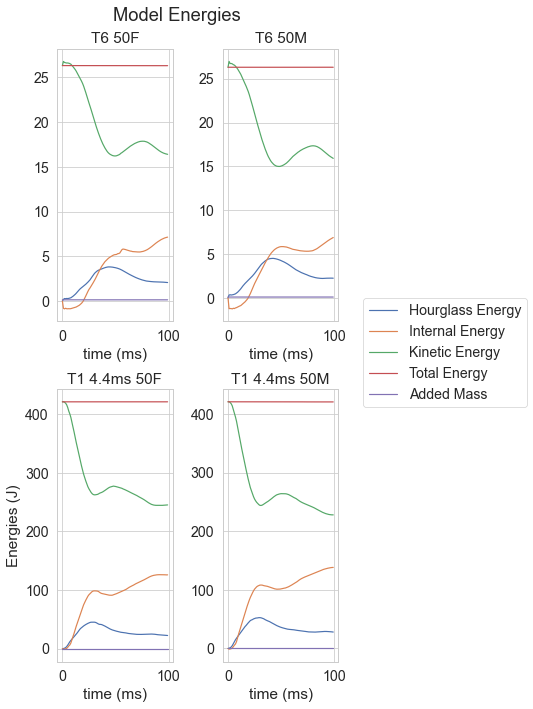
Model Energies#
Show code cell source
fig_energy, ((ax1, ax2), (ax3, ax4)) = plt.subplots(2,2,figsize=(5, 10))
#fig_energy, (ax1, ax2, ax3, ax4, ax5, ax6) = plt.subplots(1,6)
fig_energy.suptitle('Model Energies')
#ax.set_title('Simulation #1')
ax3.set_ylabel('Energies (J)')

ax1.set(title='T6 50F', xlabel='time (ms)')
ax2.set(title='T6 50M', xlabel='time (ms)')
ax3.set(title='T1 4.4ms 50F', xlabel='time (ms)')
ax4.set(title='T1 4.4ms 50M', xlabel='time (ms)')

ax1.plot(simData_50F.MODEL.Hourglass_Energy.time, simData_50F.MODEL.Hourglass_Energy.energy, label="Hourglass Energy")
ax1.plot(simData_50F.MODEL.Internal_Energy.time, simData_50F.MODEL.Internal_Energy.energy, label="Internal Energy")
ax1.plot(simData_50F.MODEL.Kinetic_Energy.time, simData_50F.MODEL.Kinetic_Energy.energy, label="Kinetic Energy")
ax1.plot(simData_50F.MODEL.Total_Energy.time, simData_50F.MODEL.Total_Energy.energy, label="Total Energy")
ax1.plot(simData_50F.MODEL.Added_Mass.time, simData_50F.MODEL.Added_Mass.mass, label="Added Mass")


ax2.plot(simData_50M.MODEL.Hourglass_Energy.time, simData_50M.MODEL.Hourglass_Energy.energy)#, #label="Hourglass Energy")
ax2.plot(simData_50M.MODEL.Internal_Energy.time, simData_50M.MODEL.Internal_Energy.energy)#, #label="Internal Energy")
ax2.plot(simData_50M.MODEL.Kinetic_Energy.time, simData_50M.MODEL.Kinetic_Energy.energy)#, #label="Kinetic Energy")
ax2.plot(simData_50M.MODEL.Total_Energy.time, simData_50M.MODEL.Total_Energy.energy)#, #label="Total Energy")
ax2.plot(simData_50M.MODEL.Added_Mass.time, simData_50M.MODEL.Added_Mass.mass)#, #label="Added Mass")


ax3.plot(simData_50F_2.MODEL.Hourglass_Energy.time, simData_50F_2.MODEL.Hourglass_Energy.energy)#, #label="Hourglass Energy")
ax3.plot(simData_50F_2.MODEL.Internal_Energy.time, simData_50F_2.MODEL.Internal_Energy.energy)#, #label="Internal Energy")
ax3.plot(simData_50F_2.MODEL.Kinetic_Energy.time, simData_50F_2.MODEL.Kinetic_Energy.energy)#, label="Kinetic Energy")
ax3.plot(simData_50F_2.MODEL.Total_Energy.time, simData_50F_2.MODEL.Total_Energy.energy)#, #label="Total Energy")
ax3.plot(simData_50F_2.MODEL.Added_Mass.time, simData_50F_2.MODEL.Added_Mass.mass)#, #label="Added Mass")


ax4.plot(simData_50M_2.MODEL.Hourglass_Energy.time, simData_50M_2.MODEL.Hourglass_Energy.energy)#, #label="Hourglass Energy")
ax4.plot(simData_50M_2.MODEL.Internal_Energy.time, simData_50M_2.MODEL.Internal_Energy.energy)#, #label="Internal Energy")
ax4.plot(simData_50M_2.MODEL.Kinetic_Energy.time, simData_50M_2.MODEL.Kinetic_Energy.energy)#, #label="Kinetic Energy")
ax4.plot(simData_50M_2.MODEL.Total_Energy.time, simData_50M_2.MODEL.Total_Energy.energy)#, #label="Total Energy")
ax4.plot(simData_50M_2.MODEL.Added_Mass.time, simData_50M_2.MODEL.Added_Mass.mass)#, #label="Added Mass")


fig_energy.tight_layout(pad=0.7)


fig_energy.legend(loc='center left', bbox_to_anchor=(1, 0.5));
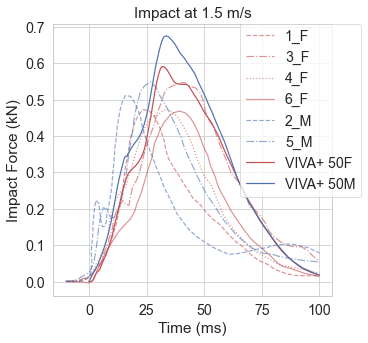
Impact force vs time#
Show code cell source
fig_ft, axs = plt.subplots(figsize=(5, 5))

axs.plot(ex_impact_force_time.F_1.X, ex_impact_force_time.F_1.Y,label="1_F", **plotExperimentFemale, linestyle = '--')
axs.plot(ex_impact_force_time.F_3.X, ex_impact_force_time.F_3.Y,label="3_F", **plotExperimentFemale, linestyle = '-.')
axs.plot(ex_impact_force_time.F_4.X, ex_impact_force_time.F_4.Y,label="4_F", **plotExperimentFemale, linestyle = ':')
axs.plot(ex_impact_force_time.F_6.X, ex_impact_force_time.F_6.Y,label="6_F", **plotExperimentFemale, linestyle = '-')
axs.plot(ex_impact_force_time.M_2.X, ex_impact_force_time.M_2.Y,label="2_M", **plotExperimentMale, linestyle = '--')
axs.plot(ex_impact_force_time.M_5.X, ex_impact_force_time.M_5.Y,label="5_M", **plotExperimentMale, linestyle = '-.')
axs.plot(simData_50F.IMPACTOR["Contactforce-impactor-to-HBM-m"].iloc[:,0], simData_50F.IMPACTOR["Contactforce-impactor-to-HBM-m"].iloc[:,1],  label="VIVA+ 50F", **plot50F)
axs.plot(simData_50M.IMPACTOR["Contactforce-impactor-to-HBM-m"].iloc[:,0], simData_50M.IMPACTOR["Contactforce-impactor-to-HBM-m"].iloc[:,1],  label="VIVA+ 50M", **plot50M)
#axs.plot(simData_50F_2.IMPACTOR["Contactforce-impactor-to-HBM-m"].iloc[:,0], simData_50F_2.IMPACTOR["Contactforce-impactor-to-HBM-m"].iloc[:,1],  label="VIVA+ 50F", **plot50F)
#axs.plot(simData_50M_2.IMPACTOR["Contactforce-impactor-to-HBM-m"].iloc[:,0], simData_50M_2.IMPACTOR["Contactforce-impactor-to-HBM-m"].iloc[:,1],  label="VIVA+ 50M", **plot50M)
axs.set_title('Impact at 1.5 m/s')
axs.set_ylabel('Impact Force (kN)')
#axs[0].plot(plotData_T1_4_4['Bone:Head_COG_z:time[ms]'], -plotData_T1_4_4['Bone:Head_COG_z:z[mm]'])

axs.set_xlabel('Time (ms)')
axs.set_ylabel('Impact Force (kN)');

#plt.xlim([0, t_lim]);
#plt.ylim([0, 8]);
fig_ft.legend(loc='upper right', bbox_to_anchor=(1, 0.9));
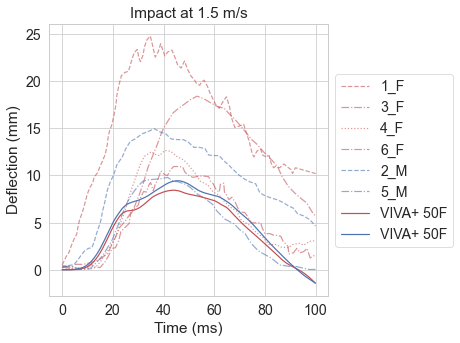
Deflection vs time#
Show code cell source
fig_dt, axs = plt.subplots(figsize=(5, 5))

axs.plot(ex_deflection_time.F_1.X, ex_deflection_time.F_1.Y,label="1_F", **plotExperimentFemale, linestyle = '--')
axs.plot(ex_deflection_time.F_3.X, ex_deflection_time.F_3.Y,label="3_F", **plotExperimentFemale, linestyle = '-.')
axs.plot(ex_deflection_time.F_4.X, ex_deflection_time.F_4.Y,label="4_F", **plotExperimentFemale, linestyle = ':')
axs.plot(ex_deflection_time.F_6.X, ex_deflection_time.F_6.Y,label="6_F", **plotExperimentFemale, linestyle = '-.')
axs.plot(ex_deflection_time.M_2.X, ex_deflection_time.M_2.Y,label="2_M", **plotExperimentMale, linestyle = '--')
axs.plot(ex_deflection_time.M_5.X, ex_deflection_time.M_5.Y,label="5_M", **plotExperimentMale, linestyle = '-.')
axs.plot(simData_50F.Bone["UX-Scapula-PC-AA-MP-L_x"].time, Acromion_deflection_50F.iloc[0]-Acromion_deflection_50F,  label="VIVA+ 50F", **plot50F)
axs.plot(simData_50M.Bone["UX-Scapula-PC-AA-MP-L_x"].time, Acromion_deflection_50M.iloc[0]-Acromion_deflection_50M,  label="VIVA+ 50F", **plot50M)
#axs.plot(simData_50F_2.Bone["UX-Scapula-PC-AA-MP-L_x"].time, Acromion_deflection_50F_2.iloc[0]-Acromion_deflection_50F_2,  label="VIVA+ 50F", **plot50F)
#axs.plot(simData_50M_2.Bone["UX-Scapula-PC-AA-MP-L_x"].time, Acromion_deflection_50M_2.iloc[0]-Acromion_deflection_50M_2,  label="VIVA+ 50F", **plot50M)
#axs.plot(simData_50M_2.IMPACTOR["Contactforce-impactor-to-HBM-m"].iloc[:,0], simData_50M.IMPACTOR["Contactforce-impactor-to-HBM-m"].iloc[:,1],  label="VIVA+ 50M", **plot50M)
axs.set_title('Impact at 1.5 m/s')
axs.set_ylabel('Deflection (mm)')
#axs[0].plot(plotData_T1_4_4['Bone:Head_COG_z:time[ms]'], -plotData_T1_4_4['Bone:Head_COG_z:z[mm]'])

axs.set_xlabel('Time (ms)')


#plt.xlim([0, 71]);
#plt.ylim([0, 8]);
fig_dt.legend(loc='center left', bbox_to_anchor=(0.9, 0.5));
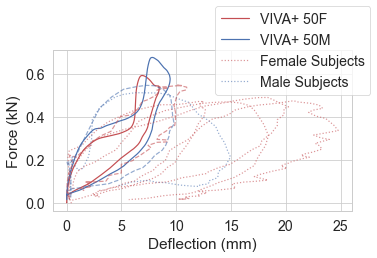
Force and Deflection#
Low Speed Force vs Deflection#
Show code cell source
fig_fdl, axs = plt.subplots(figsize=(5, 3))

axs.plot(shoulder_deflection_50F.values[shoulder_deflection_50F>0], simData_50F.IMPACTOR["Contactforce-impactor-to-HBM-m"].iloc[:,1].values.reshape(-1,1)[shoulder_deflection_50F.values>0], label="VIVA+ 50F", **plot50F)
axs.plot(shoulder_deflection_50M.values[shoulder_deflection_50M>0], simData_50M.IMPACTOR["Contactforce-impactor-to-HBM-m"].iloc[:,1].values.reshape(-1,1)[shoulder_deflection_50M.values>0], label="VIVA+ 50M", **plot50M)

axs.plot(ex_deflection_time.F_1.Y, f1(ex_deflection_time.F_1.X), **plotExperimentFemale, linestyle = ':', label="Female Subjects")
axs.plot(ex_deflection_time.M_2.Y, f2(ex_deflection_time.M_2.X), **plotExperimentMale, linestyle = ':', label="Male Subjects")
axs.plot(ex_deflection_time.F_3.Y, f3(ex_deflection_time.F_3.X), **plotExperimentFemale, linestyle = '--')
axs.plot(ex_deflection_time.F_4.Y, f4(ex_deflection_time.F_4.X), **plotExperimentFemale, linestyle = ':')
axs.plot(ex_deflection_time.M_5.Y, f5(ex_deflection_time.M_5.X), **plotExperimentMale, linestyle = '--')
axs.plot(ex_deflection_time.F_6.Y, f6(ex_deflection_time.F_6.X), **plotExperimentFemale, linestyle = ':')
axs.plot(ex_deflection_time.F_7.Y, f7(ex_deflection_time.F_7.X), **plotExperimentFemale, linestyle = ':')

#axs.set_title('Impact at 1.5 m/s')
axs.set_ylabel('Force (kN)')
axs.set_xlabel('Deflection (mm)')
fig_fdl.legend(loc="upper right", bbox_to_anchor=(1.05, 1.2));
fig_fdl.tight_layout(pad=0.5);
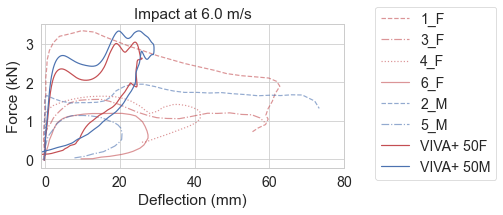
High Speed Force vs Deflection#
Show code cell source
fig_fdh, axs = plt.subplots(figsize=(5, 3))

axs.plot(ex_impact_force_deflection_6_0.F_1.X, ex_impact_force_deflection_6_0.F_1.Y,label="1_F", **plotExperimentFemale, linestyle = '--')
axs.plot(ex_impact_force_deflection_6_0.F_3.X, ex_impact_force_deflection_6_0.F_3.Y,label="3_F", **plotExperimentFemale2, linestyle = '-.')
axs.plot(ex_impact_force_deflection_6_0.F_4.X, ex_impact_force_deflection_6_0.F_4.Y,label="4_F", **plotExperimentFemale, linestyle = ':')
axs.plot(ex_impact_force_deflection_6_0.F_6.X, ex_impact_force_deflection_6_0.F_6.Y,label="6_F", **plotExperimentFemale2, linestyle = '-')
axs.plot(ex_impact_force_deflection_6_0.M_2.X, ex_impact_force_deflection_6_0.M_2.Y,label="2_M", **plotExperimentMale, linestyle = '--')
axs.plot(ex_impact_force_deflection_6_0.M_5.X, ex_impact_force_deflection_6_0.M_5.Y,label="5_M", **plotExperimentMale2, linestyle = '-.')
axs.plot(F[(Impactor_F>0.1)], Impactor_F[(Impactor_F>0.1)],  label="VIVA+ 50F", **plot50F)
axs.plot(M[Impactor_M>0.1], Impactor_M[Impactor_M>0.1],  label="VIVA+ 50M", **plot50M)

axs.set_title('Impact at 6.0 m/s')

axs.set_ylabel('Force (kN)');

axs.set_xlabel('Deflection (mm)');
plt.xlim([-1, 80])
fig_fdh.legend(loc="upper right", bbox_to_anchor=(1.4, 1));
fig_fdh.tight_layout(pad=0.5);