Knee Valgus Bending (Bose 2008)#
Model validation information
Performed by : Matej Kranjec
Reviewed by :
Version |
Date |
Performed by |
LS-Dyna |
|---|---|---|---|
0.3.2 |
2022-10-18 |
Matej Kranjec |
9.3.1 |
0.3.3 |
2022-11-30 |
Matej Kranjec |
9.3.1 |
1.0.2 |
2023-11-23 |
Matej Kranjec |
9.3.1 |
1.1.1 |
2024-05-22 |
Matej Kranjec |
12.2.1 |
Added to VIVA+ Validation Catalog on 2022-10-18 by Matej Kranjec
© 2019-2024, OpenVT Organization (OVTO)
Available openly under under Creative Commons Attribution 4.0 International License 
Experiment by Bose et al. (2008)#
Summary:#
This is a simulation of 4 point (valgus) bending experiment of a human knee. The angular velocity of the experiment is similar as in pedestrian-vehicle side impact scenario at approximately 40 km/h. The simulated results are compared to the experimental results from Bose et al. 2008
Experiment#
Information on the subjects/specimens#
Number of subjects/specimens: 12/16
Sex: female and male (results not sex differentiated)
Mass: 75.2 \(\pm\) 14.4 kg
Height: 172 \(\pm\) 7.8 cm
Age: 68.3 \(\pm\) 9.8 yr
In the full study, forty knee specimens were harvested from 18 male and 6 female adult human cadavers. Only 16 specimens were used for this experimental loadcase.
Loading and Boundary Conditions#
The isolated knee joint specimens were potted with Cerrobend™ (cerro-bismuth alloy) in metal cups fixed to extension bars and loaded in four-point bending configuration to measure the valgus moment at bending loading. Both extension bars are free to rotate around the hinge joints (one degree of freedom). The hinge joint of the extension bar on the tibial side is also able to move horizontally. Loading of the setup is done by pushing the fork-like actuator downwards and thus moving the extension bars.
Impact#
The dynamic bending rate of the knee was chosen to be 1.5 deg/ms to represent a 40 km/h pedestrian-car collision.
Positioning#
The knee part of VIVA+ model was isolated from the full standing models (50F and 50M respectively) to correspond to the shape of specimens used in experimental setup. The model was stripped of the soft tissues where it was constrained in the cups. The isolated knee model was positioned into the FE model of the experimental setup (included in the package).
Responses recorded#
The reference result values from the paper were digitalised. This data represents the min/max corridor of all the specimens.
Other Notes for simulation#
For this validation an experimental setup had to be developed (dyna/Setup/Setup-Bose-4point.k). The knee model has to be extracted from the whole HBM (deletion of some parts of the bones, flesh and some ligaments from interosseous membrane. Great care has to be taken to include all knee contact definitions and constraints (internal knee contact, external knee contact, extra nodes on patella).
Simulation results#
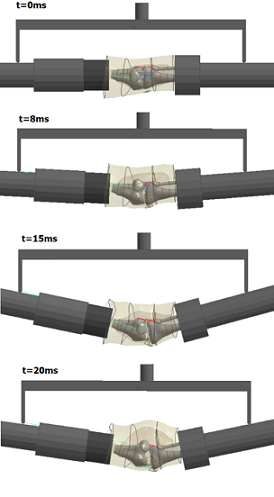
(Figure above shows results of the validation simulation using VIVA+ 50F model)
# write metadata
metadata={
  "date": date,
  "name": name,
  "n_cpu": n_cpu,
  "dyna_executable_name": dyna_executable_name,
  "platform": platform,
  "os_level": os_level
}

with open(os.path.join(processed_data_dir, simulation_meta_file_name), 'w+') as f:
  json.dump(metadata, f, indent=4)
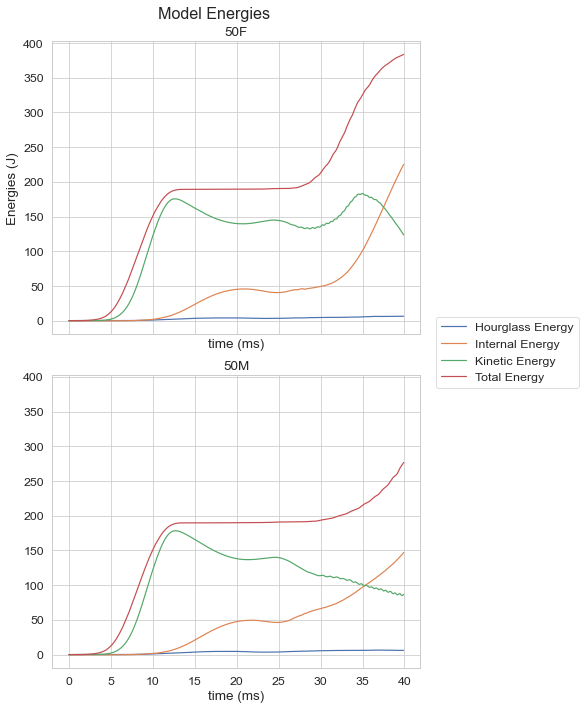
Model Energies#
Show code cell source
#fig_energy, ax1 = plt.subplots(nrows=1, ncols=1, sharex=True, sharey=True,figsize=(5, 5))
fig_energy, (ax1, ax2) = plt.subplots(nrows=2, ncols=1, sharex=True, sharey=True, figsize= (6,10))
fig_energy.suptitle('Model Energies')
ax1.set_ylabel('Energies (J)')

ax1.set(title='50F', xlabel='time (ms)')
ax2.set(title='50M', xlabel='time (ms)')


ax1.plot(simData_50F.MODEL.Hourglass_Energy_time.time, simData_50F.MODEL.Hourglass_Energy_time.hourglass_energy, label="Hourglass Energy")
ax1.plot(simData_50F.MODEL.Internal_Energy_time.time, simData_50F.MODEL.Internal_Energy_time.internal_energy, label="Internal Energy")
ax1.plot(simData_50F.MODEL.Kinetic_Energy_time.time, simData_50F.MODEL.Kinetic_Energy_time.kinetic_energy, label="Kinetic Energy")
ax1.plot(simData_50F.MODEL.Total_Energy_time.time, simData_50F.MODEL.Total_Energy_time.total_energy, label="Total Energy")
#ax1.plot(simData_50F.MODEL.Added_Mass_time.time, simData_50F.MODEL.Added_Mass_time.Added_mass, label="Added Mass")


ax2.plot(simData_50M.MODEL.Hourglass_Energy_time.time, simData_50M.MODEL.Hourglass_Energy_time.hourglass_energy)#, label="Hourglass Energy")
ax2.plot(simData_50M.MODEL.Internal_Energy_time.time, simData_50M.MODEL.Internal_Energy_time.internal_energy)#, label="Internal Energy")
ax2.plot(simData_50M.MODEL.Kinetic_Energy_time.time, simData_50M.MODEL.Kinetic_Energy_time.kinetic_energy)#, label="Kinetic Energy")
ax2.plot(simData_50M.MODEL.Total_Energy_time.time, simData_50M.MODEL.Total_Energy_time.total_energy)#, label="Total Energy")
#ax1.plot(simData_50M.MODEL.Added_Mass_time.time, simData_50M.MODEL.Added_Mass_time.Added_mass, label="Added Mass")

fig_energy.tight_layout(pad=0.7)
fig_energy.legend(loc='center left', bbox_to_anchor=(1, 0.5));
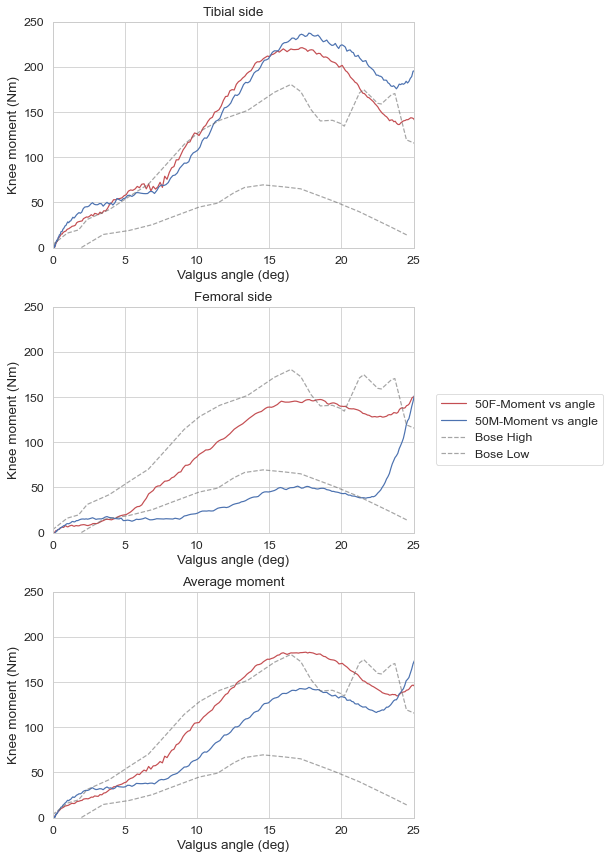
Knee bending - Moment vs Valgus angle#
1,5 deg/ms bending speed#
Show code cell source
## Figures
fig_MvA_50F, (axs1,axs2,axs3) = plt.subplots(nrows=3, ncols=1, sharex=False, sharey=True,figsize=(6, 12))
#fig_MvA_50F.suptitle('Moments vs Valgus angle')

axs1.plot(simData_50F_Knee_valgus_angle, -simData_50F.Knee.Tibial_CS_moment.moment, **plot50F)
axs1.plot(simData_50M_Knee_valgus_angle, -simData_50M.Knee.Tibial_CS_moment.moment, **plot50M)
axs1.plot(experiment.EXPERIMENT.HIGH.Angle, experiment.EXPERIMENT.HIGH.Moment, **plotExperiment)
axs1.plot(experiment.EXPERIMENT.LOW.Angle, experiment.EXPERIMENT.LOW.Moment, **plotExperiment)

axs2.plot(simData_50F_Knee_valgus_angle, -simData_50F.Knee.Femoral_CS_moment.moment, **plot50F)
axs2.plot(simData_50M_Knee_valgus_angle, -simData_50M.Knee.Femoral_CS_moment.moment, **plot50M)
axs2.plot(experiment.EXPERIMENT.HIGH.Angle, experiment.EXPERIMENT.HIGH.Moment, **plotExperiment)
axs2.plot(experiment.EXPERIMENT.LOW.Angle, experiment.EXPERIMENT.LOW.Moment, **plotExperiment)

axs3.plot(simData_50F_Knee_valgus_angle, simData_50F_Average_CS_moment, label="50F-Moment vs angle", **plot50F)
axs3.plot(simData_50M_Knee_valgus_angle, simData_50M_Average_CS_moment, label="50M-Moment vs angle", **plot50M)
axs3.plot(experiment.EXPERIMENT.HIGH.Angle, experiment.EXPERIMENT.HIGH.Moment, label="Bose High", **plotExperiment)
axs3.plot(experiment.EXPERIMENT.LOW.Angle, experiment.EXPERIMENT.LOW.Moment, label="Bose Low", **plotExperiment)

axs1.set(title="Tibial side", xlabel ="Valgus angle (deg)", ylabel="Knee moment (Nm)")
axs1.set_xlim(0,25)
axs1.set_ylim(0,200)
axs2.set(title="Femoral side", xlabel ="Valgus angle (deg)", ylabel="Knee moment (Nm)")
axs2.set_xlim(0,25)
axs2.set_ylim(0,250)
axs3.set(title="Average moment", xlabel ="Valgus angle (deg)", ylabel="Knee moment (Nm)")
axs3.set_xlim(0,25)
axs3.set_ylim(0,250)

fig_MvA_50F.legend(loc='center left', bbox_to_anchor=(1, 0.5))
fig_MvA_50F.tight_layout(pad=0.7);