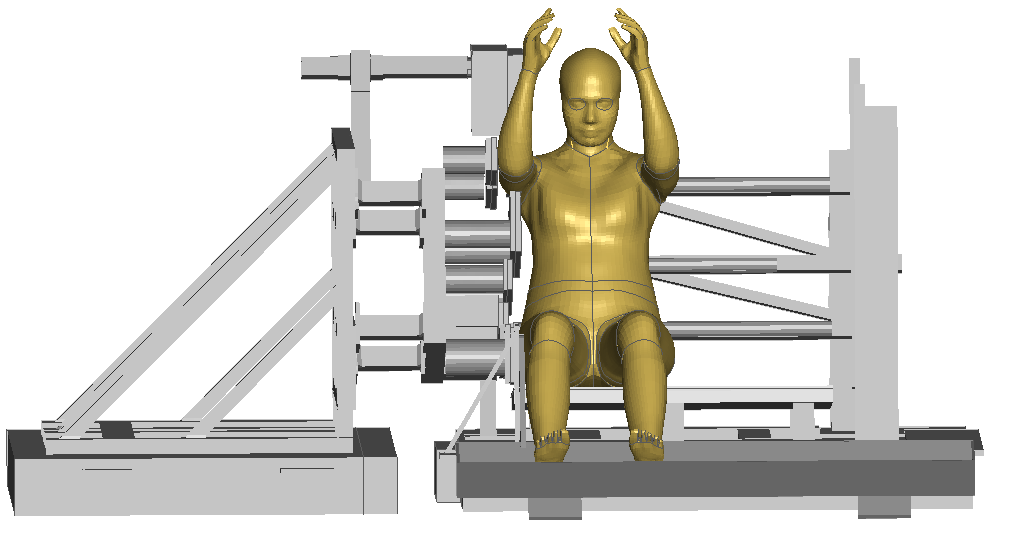
Nearside Lateral impact (Miller 2013/Wood 2014)#
Postprocessing of Hub Lateral Impacts based on Wood et al.,2014 (for 50F model) and Miller et al., 2013 (for 50M model).
Model validation information
Performed by : Johan Iraeus & Matej Kranjec
Reviewed by :
Added to VIVA+ Validation Catalog on : 2022-11-28
Last modified: 2023-11-23
VIVA+ model version (this notebook run for): 0.3.2
© 2019-2023, OpenVT Organization (OVTO)
Available openly under Creative Commons Attribution 4.0 International License 
Experiment by Miller et al. (2013) and Wood et al. (2014)#
The simulated outputs are compared to the references from PMHS tests reported by Miller et al., 2013 and Wood et al. (2014).
Miller, C. S., Madura, N. H., Schneider, L. W., Klinich, K. D., Reed, M. P., & Rupp, J. D. (2013). PMHS Impact Response in 3 m/s and 8 m/s Nearside Impacts with Abdomen Offset. Stapp car crash journal, 57, 387.
Wood, L. K., Miller, C. S., Madura, N. H., Reed, M. P., Schneider, L. W., Klinich, K. D., & Rupp, J. D. (2014). Response and tolerance of female and/or elderly PMHS to lateral impact. Stapp car crash journal, 58, 423.

Experiment#
Information on the subjects/specimens#
Wood et al. included 6 female and 2 male specimen (average age: 75 yrs, average mass: 58 kg, average height: 162 cm)
Miller et al. included 7 male specimen (average age: 66 yrs, average mass: 78 kg, average height: 177 cm)
Loading and Boundary Conditions#
A padded side impact sled was used at impacts speeds ranging from 3 to 10m/s.
Impact#
Impactor plates were located at head, thorax, abdomen, pelvis, and femur.
Positioning#
The VIVA+ model is repositioned from the nominal seated position to the test position (including raised arms, using pulling cables and gravity settling, during the first 350ms. For the first 300ms global damping is applied.
Responses recorded#
The reference force-displacement corridors from the paper were digitalized and are included in the package.
Other Notes for simulation#
In the referenced paper it is suggested that the arms were released at time zero. However, after examine videos from the tests, this was the case for some of the PMHS tests, while other released late in the sequence and in some cases not at all. In the simulation model the arms are kept suspended for the whole duration.
VIVA+ 50F responses compared to Wood 2014#
In the figure below the simulation responses of the 50F model (red curves) are compared to the PMHS corridors from Wood et al. (2014).
Show code cell content
#Results for Wood 2014
sampling_time_50F= simData_50F.CONTACT.Thorax_ForceF.time - 350
thorax_force_50F =  1000 * simData_50F.CONTACT.Thorax_ForceF.force
abdominal_force_50F = 1000 * simData_50F.CONTACT.Abdominal_ForceF.force
pelvic_GT_force_50F = 1000 * simData_50F.CONTACT.Pelvic_GT_ForceF.force
pelvic_IW_force_50F = 1000 * simData_50F.CONTACT.Pelvic_IW_ForceF.force
pelvic_combined_force_50F = pelvic_GT_force_50F + pelvic_IW_force_50F
femur_mid_shaft_force_50F = 1000 * simData_50F.CONTACT.Femur_Mid_Shaft_ForceF.force
Show code cell source
fig_Wood_Forces, ((axs1,axs2,axs3),(axs4,axs5,axs6)) = plt.subplots(nrows=2, ncols=3, sharex=True, sharey=True,figsize=(30, 15))

axs1.plot(sampling_time_50F, thorax_force_50F, label="VIVA+ 50F", **plot50F)
axs1.plot(experiment_50F.ThoraxForce.Time_Thorax, experiment_50F.ThoraxForce.Force_Thorax, label="Corridor", **plotExperiment)
axs2.plot(sampling_time_50F, abdominal_force_50F, **plot50F)
axs2.plot(experiment_50F.AbdominalForce.Time_Abdominal, experiment_50F.AbdominalForce.Force_Abdominal, **plotExperiment)
axs3.plot(sampling_time_50F, pelvic_GT_force_50F, **plot50F)
axs3.plot(experiment_50F.PelvicGTForce.Time_Pelvic_GT, experiment_50F.PelvicGTForce.Force_Pelvic_GT, **plotExperiment)
axs4.plot(sampling_time_50F, pelvic_IW_force_50F, **plot50F)
axs4.plot(experiment_50F.PelvicIWForce.Time_Pelvic_IW, experiment_50F.PelvicIWForce.Force_Pelvic_IW, **plotExperiment)
axs5.plot(sampling_time_50F, pelvic_combined_force_50F, **plot50F)
axs5.plot(experiment_50F.PelvicCombinedForce.Time_Pelvic_combined, experiment_50F.PelvicCombinedForce.Force_Pelvic_combined, **plotExperiment)
axs6.plot(sampling_time_50F, femur_mid_shaft_force_50F, **plot50F)
axs6.plot(experiment_50F.FemurMidShaftForce.Time_Femur, experiment_50F.FemurMidShaftForce.Force_Femur, **plotExperiment)

axs1.set_ylabel('Thorax Force (N)');
axs2.set_ylabel('Abdominal Force (N)');
axs3.set_ylabel('Pelvic G.T. Force (N)');
axs4.set_ylabel('Pelvic I.W. Force (N)');
axs5.set_ylabel('Pelvis Combined Force (N)');
axs6.set_ylabel('Femur Shaft Force (N)');
axs6.set_xlabel('Time (ms)')
axs6.set_xlim(0,100)

fig_Wood_Forces.tight_layout(pad=0.5)
fig_Wood_Forces.legend(loc='upper right', bbox_to_anchor=(1.05, 1.05));

VIVA+ 50M responses compared to Miller 2013#
In the figure below the simulation responses of the 50M model (blue curves) are compared to the PMHS corridors from Miller et al. (2013).
Show code cell content
#Results for Miller 2013
sampling_time_50M = simData_50M.CONTACT.Thorax_Force.time - 350
thorax_force_50M =  1000 * simData_50M.CONTACT.Thorax_Force.force
abdominal_force_50M = 1000 * simData_50M.CONTACT.Abdominal_Force.force
pelvic_GT_force_50M = 1000 * simData_50M.CONTACT.Pelvic_GT_Force.force
pelvic_IW_force_50M = 1000 * simData_50M.CONTACT.Pelvic_IW_Force.force
pelvic_combined_force_50M = pelvic_GT_force_50M + pelvic_IW_force_50M
femur_mid_shaft_force_50M = 1000 * simData_50M.CONTACT.Femur_Mid_Shaft_Force.force
Show code cell source
fig_Miller_Forces, ((axs1,axs2,axs3),(axs4,axs5,axs6)) = plt.subplots(nrows=2, ncols=3, sharex=True, sharey=True,figsize=(30, 15))

axs1.plot(sampling_time_50M, thorax_force_50M, label="VIVA+ 50M", **plot50M)
axs1.plot(experiment_50M.ThoraxForce.Time_Thorax, experiment_50M.ThoraxForce.Force_Thorax, label="Corridor", **plotExperiment)
axs2.plot(sampling_time_50M, abdominal_force_50M, **plot50M)
axs2.plot(experiment_50M.AbdominalForce.Time_Abdominal, experiment_50M.AbdominalForce.Force_Abdominal, **plotExperiment)
axs3.plot(sampling_time_50M, pelvic_GT_force_50M, **plot50M)
axs3.plot(experiment_50M.PelvicGTForce.Time_Pelvic_GT, experiment_50M.PelvicGTForce.Force_Pelvic_GT, **plotExperiment)
axs4.plot(sampling_time_50M, pelvic_IW_force_50M, **plot50M)
axs4.plot(experiment_50M.PelvicIWForce.Time_Pelvic_IW, experiment_50M.PelvicIWForce.Force_Pelvic_IW, **plotExperiment)
axs5.plot(sampling_time_50M, pelvic_combined_force_50M, **plot50M)
axs5.plot(experiment_50M.PelvicCombinedForce.Time_Pelvic_combined, experiment_50M.PelvicCombinedForce.Force_Pelvic_combined, **plotExperiment)
axs6.plot(sampling_time_50M, femur_mid_shaft_force_50M, **plot50M)
axs6.plot(experiment_50M.FemurMidShaftForce.Time_Femur, experiment_50M.FemurMidShaftForce.Force_Femur, **plotExperiment)

axs1.set_ylabel('Thorax Force (N)');
axs2.set_ylabel('Abdominal Force (N)');
axs3.set_ylabel('Pelvic G.T. Force (N)');
axs4.set_ylabel('Pelvic I.W. Force (N)');
axs5.set_ylabel('Pelvis Combined Force (N)');
axs6.set_ylabel('Femur Shaft Force (N)');
axs6.set_xlabel('Time (ms)')
axs6.set_xlim(0,100)

fig_Miller_Forces.tight_layout(pad=0.5)
fig_Miller_Forces.legend(loc='upper right', bbox_to_anchor=(1.05, 1.05));

