Pedestrian (Forman 2015)#
Model validation information
Performed by: Nico Erlinger, Elena Weißenbacher
Reviewed by: Corina Klug
Added to VIVA+ Validation Catalog on 2022-11-30 by Corina Klug
Version |
Date |
Performed by |
LS-Dyna |
|---|---|---|---|
2022-11-30 |
Nico Erlinger, Elena Weißenbacher |
9.3.1 |
|
0.3.2 |
2023-11-23 |
Corina Klug |
9.3.1 |
1.1.1 |
2024-06-04 |
Matej Kranjec |
12.2.1 |
© 2019-2024, OpenVT Organization (OVTO)
Available openly under under Creative Commons Attribution 4.0 International License 
Reference#
Experiments by Forman et al. (2015)#
Forman, J., Joodaki, H., Forghani, A., O Riley, P., Bollapragada, V., Lessley, D., Overby, B., Heltzel, S., Crandall, J., 2015a. Biofidelity Corridors for Whole‐Body Pedestrian Impact with a Generic Buck, in: 2015 IRCOBI Conference Proceedings. IRCOBI Conference, Lyon, France. 9.-11.9.2015. IRCOBI, pp. 356–372. http://www.ircobi.org/wordpress/downloads/irc15/pdf_files/49.pdf
Forman, J.L., Joodaki, H., Forghani, A., Riley, P.O., Bollapragada, V., Lessley, D.J., Overby, B., Heltzel, S., Kerrigan, J.R., Crandall, J.R., Yarboro, S., Weiss, D.B., 2015. Whole-body Response for Pedestrian Impact with a Generic Sedan Buck. Stapp Car Crash J 59, 401–444.
VIVA+ validation#
Manuscript currently under preparation
Information on the subjects/specimens#
PMHS |
Sex |
Height [cm] |
Weight [kg] |
Age [yr] |
Scale factor z (height) |
Scale factor x and y (weight) |
|---|---|---|---|---|---|---|
V2370 |
m |
180 |
73 |
73 |
1.02 |
0.96 |
V2371 |
m |
187 |
82 |
54 |
1.07 |
1.00 |
V2374 |
m |
178 |
78 |
67 |
1.02 |
1.00 |
V2370 |
V2371 |
V2374 |
|||||
|---|---|---|---|---|---|---|---|
Experiment [°] |
pos. VIVA+ [°] |
Experiment [°] |
pos. VIVA+ [°] |
Experiment [°] |
pos. VIVA+ [°] |
||
side view |
Right lower leg |
76 |
75 |
65 |
68 |
60 |
63 |
Right upper leg |
95 |
92 |
94 |
89 |
97 |
94 |
|
Left lower leg |
84 |
88 |
96 |
100 |
97 |
101 |
|
Left upper leg |
114 |
108 |
100 |
99 |
97 |
97 |
|
Right lower arm |
- |
45 |
- |
38 |
- |
29 |
|
Right upper arm |
63 |
63 |
49 |
56 |
17 |
48 |
|
Left lower arm |
- |
51 |
- |
50 |
- |
40 |
|
Left upper arm |
59 |
64 |
54 |
62 |
10 |
53 |
|
front view |
Right lower leg |
84 |
81 |
85 |
80 |
81 |
78 |
Right upper leg |
90 |
91 |
94 |
96 |
89 |
86 |
|
Left lower leg |
94 |
94 |
95 |
100 |
92 |
97 |
|
Left upper leg |
94 |
98 |
89 |
93 |
93 |
95 |
|
Right lower arm |
- |
58 |
- |
54 |
- |
40 |
|
Right upper arm |
- |
84 |
- |
85 |
- |
92 |
|
Left lower arm |
- |
55 |
- |
54 |
- |
43 |
|
Left upper arm |
- |
96 |
- |
96 |
- |
89 |
|
Pelvis |
- |
1 |
- |
1 |
- |
1 |
|
Upper body centreline |
- |
90 |
- |
90 |
- |
90 |
|
Shoulder |
- |
0 |
- |
0 |
- |
0 |
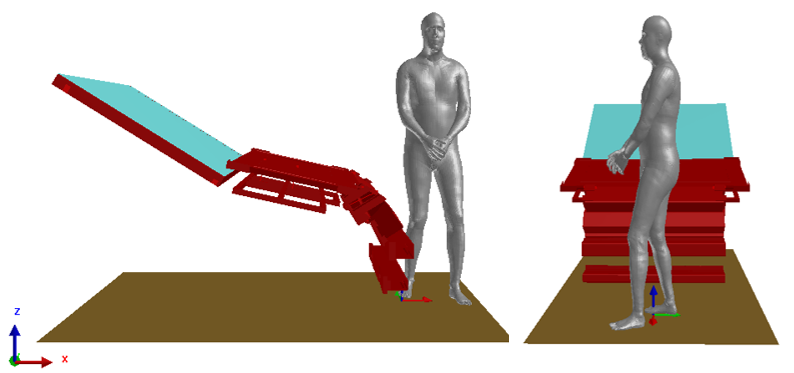
Loading and Boundary Conditions#
Simulation model of the generic buck was downloaded from the THUMS User Community (https://tuc-project.org/whole-body-pedestrian-impact)
Experimental responses#
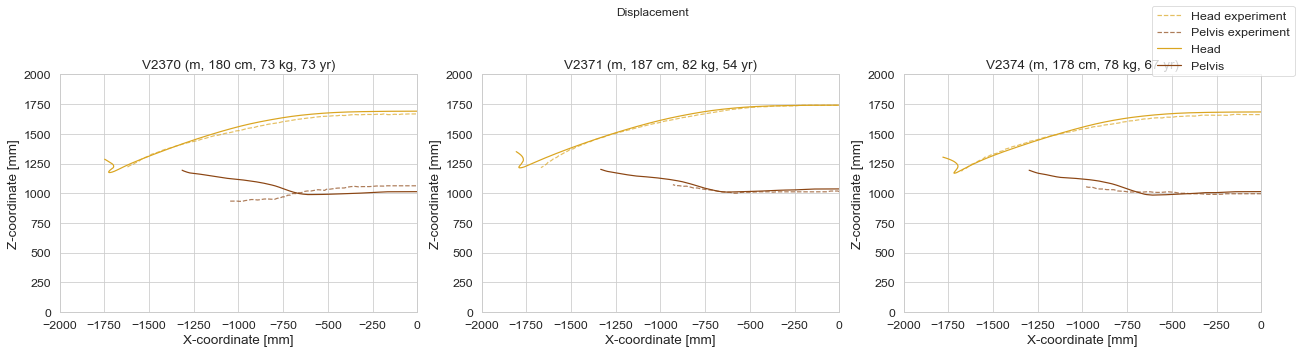
The displacement curves from the diagrams published by Forman et al. (2015) were digitised with WebPlotDigitizer v4.4 (https://automeris.io/WebPlotDigitizer).
Simulation metadata#
Results#
Trajectories#
Show code cell source
simulation_titles = ['V2370 (m, 180 cm, 73 kg, 73 yr)',
                     'V2371 (m, 187 cm, 82 kg, 54 yr)',
                     'V2374 (m, 178 cm, 78 kg, 67 yr)']


create_subplots(
figure_title = 'Displacement',
sim_x_data = ('HEAD', 'Head_COG_x-displacement', 'displacement'),
sim_y_data = ('HEAD', 'Head_COG_z-coordinate', 'coordinate'),
sim_x_data2 = ('PELVIS', 'Pelvis_sacrum_x-displacement', 'displacement'),
sim_y_data2 = ('PELVIS', 'Pelvis_sacrum_z-coordinate', 'coordinate'),
sim_name1_legend = 'Head',
sim_name2_legend = 'Pelvis',
exp_x_data = ('Head', 'x-coordinate', 'coordinate'),
exp_y_data = ('Head', 'z-coordinate', 'coordinate'),
exp_name1_legend = 'Head experiment',
exp_x_data2 = ('Pelvis', 'x-coordinate', 'coordinate'),
exp_y_data2 = ('Pelvis', 'z-coordinate', 'coordinate'),
exp_name2_legend = 'Pelvis experiment',
sim_data_for_calculation_x = ('BUCK', 'Buck_COG_x-displacement', 'displacement'),
x_label = ('X-coordinate [mm]'),
y_label = ('Z-coordinate [mm]'),
x_lim = [-2000, 0],
y_lim = [0, 2000],
filename_save = 'results/figures/VIVA+_Forman_et_al_2015_x-displacement_time.svg' )
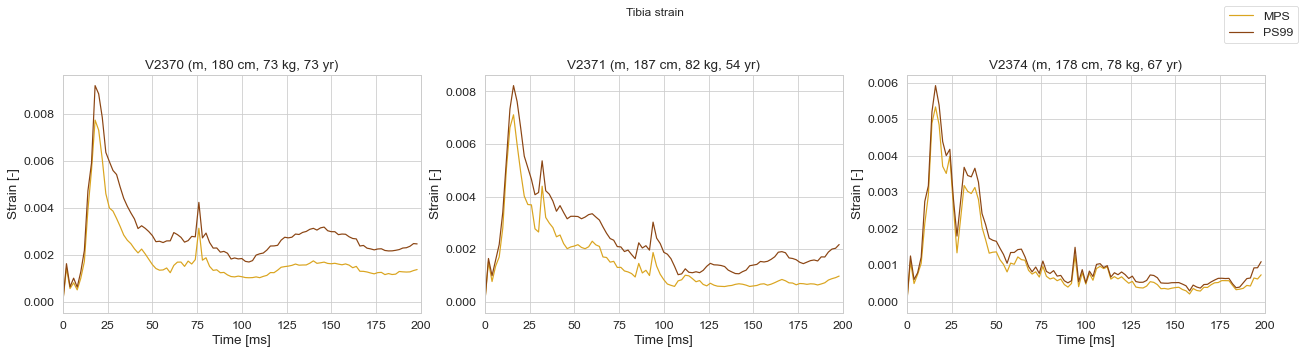
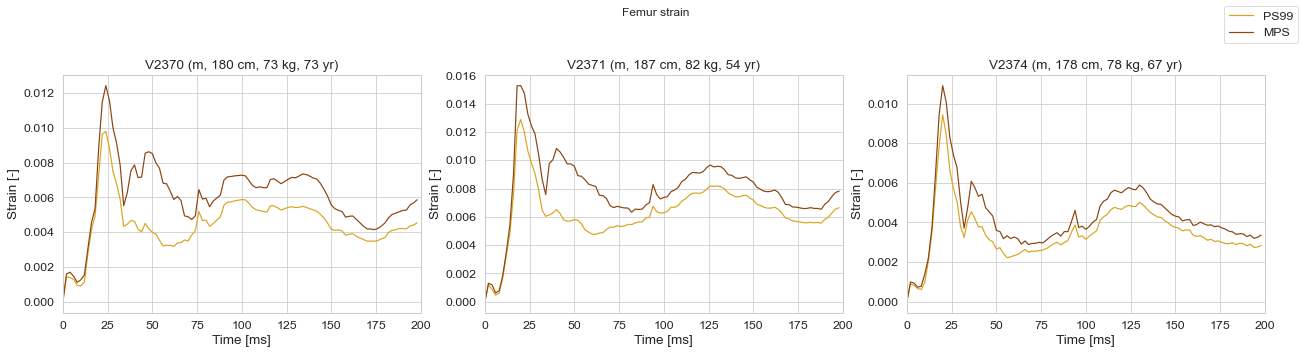
Tibia and femur strains#
Show code cell source
create_subplots(
figure_title = 'Tibia strain',
sim_x_data = ('BONES', 'Tibia_Cortical_R_PS99', 'time'),
sim_y_data = ('BONES', 'Tibia_Cortical_R_PS99', 'strain'),
sim_x_data2 = ('BONES', 'Tibia_Cortical_R_MPS', 'time'),
sim_y_data2 = ('BONES', 'Tibia_Cortical_R_MPS', 'strain'),
sim_name1_legend = 'MPS',
sim_name2_legend = 'PS99',
x_label = 'Time [ms]',
y_label = 'Strain [-]',
x_lim = [0, 200],
filename_save = 'results/figures/Forman_et_al_2015_tibia_r_strain_time.svg')

create_subplots(
figure_title = 'Femur strain',
sim_x_data = ('BONES', 'Femur_Cortical_R_PS99', 'time'),
sim_y_data = ('BONES', 'Femur_Cortical_R_PS99', 'strain'),
sim_x_data2 = ('BONES', 'Femur_Cortical_R_MPS', 'time'),
sim_y_data2 = ('BONES', 'Femur_Cortical_R_MPS', 'strain'),
sim_name1_legend = 'PS99',
sim_name2_legend = 'MPS',
x_label = 'Time [ms]',
y_label = 'Strain [-]',
x_lim = [0, 200],
filename_save = 'results/figures/Forman_et_al_2015_femur_r_strain_time.svg')
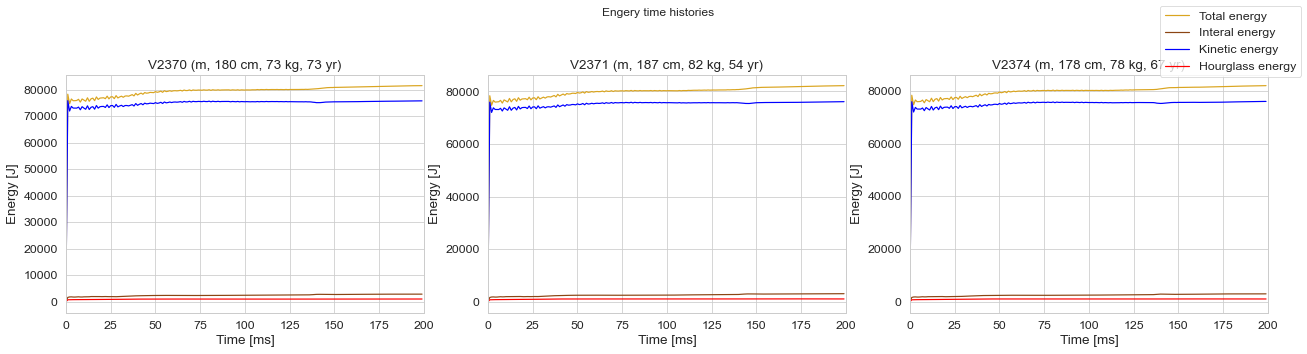
Energy time histories#
Show code cell source
create_subplots(
figure_title = 'Engery time histories',
sim_x_data = ('MODEL', 'Total_Energy', 'time'),
sim_y_data = ('MODEL', 'Total_Energy', 'energy'),
sim_x_data2 = ('MODEL', 'Internal_Energy', 'time'),
sim_y_data2 = ('MODEL', 'Internal_Energy', 'energy'),
sim_x_data3 = ('MODEL', 'Kinetic_Energy', 'time'),
sim_y_data3 = ('MODEL', 'Kinetic_Energy', 'energy'),
sim_x_data4 = ('MODEL', 'Hourglass_Energy', 'time'),
sim_y_data4 = ('MODEL', 'Hourglass_Energy', 'energy'),
sim_name1_legend = 'Total energy',
sim_name2_legend = 'Interal energy',
sim_name3_legend = 'Kinetic energy',
sim_name4_legend = 'Hourglass energy',
x_label = 'Time [ms]',
y_label = 'Energy [J]',
x_lim = [0, 200],
filename_save = 'results/figures/Forman_energy_time_histories.svg')
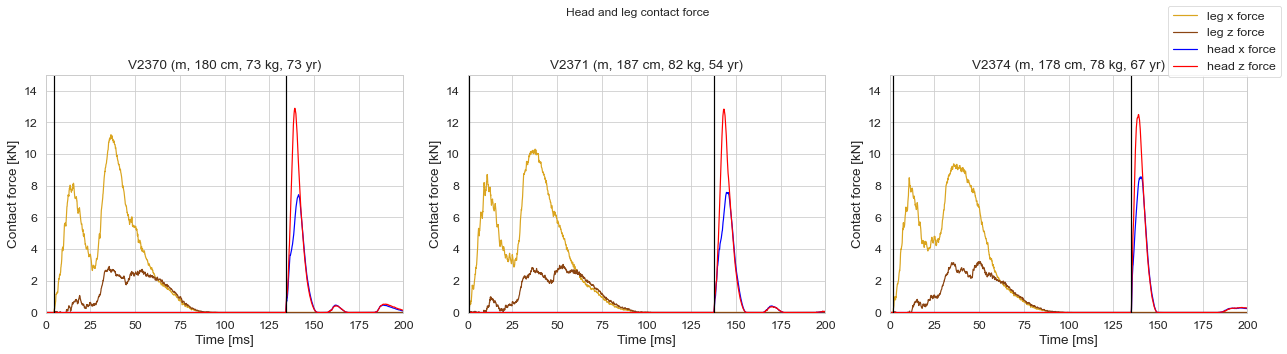
Head impact times#
Show code cell source
def calculate_head_impact_time(sim_x_data_leg, sim_y_data_leg, sim_x_data_head, sim_y_data_head):
  counter = 0
  time_array =[]

  for i in simulation_list:
    processed_data_path = os.path.join(processed_data_dir, i).replace('\\', '/')
    simData = pd.read_csv(os.path.join(processed_data_path, dynasaur_output_file_name),
                                        delimiter=';', na_values='-', header = [0,1,2,3])


    leg_contact_force_time = np.array(simData[sim_x_data_leg]).flatten()
    leg_contact_force = np.array(simData[sim_y_data_leg]).flatten()
    ind_pos_leg_contact_force = np.where(leg_contact_force > 0.01)
    ind_first_leg_contact = ind_pos_leg_contact_force[0][0]
    first_leg_contact_time = leg_contact_force_time[ind_first_leg_contact]

    head_contact_force_time = np.array(simData[sim_x_data_head]).flatten()
    head_contact_force = np.array(simData[sim_y_data_head]).flatten()
    ind_pos_head_contact_force = np.where(head_contact_force > 0.01)
    ind_first_head_contact = ind_pos_head_contact_force[0][0]
    first_head_contact_time = head_contact_force_time[ind_first_head_contact]

    head_contact_time = first_head_contact_time-first_leg_contact_time
    head_contact_time = round(head_contact_time)

    time_array.append([i, first_leg_contact_time, first_head_contact_time, head_contact_time])

  hit_array = []
  hit_array = np.append(hit_array, time_array)
  hit_array = hit_array.transpose()
  hit_array = np.reshape(hit_array, (3,4))
  return(hit_array)
Show code cell source
hit_array = calculate_head_impact_time(
sim_x_data_leg = ('HBM', 'HBM_Leg_Vehicle_Contact_Transducer_x_force', 'time'),
sim_y_data_leg = ('HBM', 'HBM_Leg_Vehicle_Contact_Transducer_x_force', 'force'),
sim_x_data_head = ('HBM', 'HBM_Head_Vehicle_Contact_Transducer_z_force', 'time'),
sim_y_data_head = ('HBM', 'HBM_Head_Vehicle_Contact_Transducer_z_force', 'force')
)

head_time_exp = [135, 138, 141]
hit_df = pd.DataFrame(hit_array, columns=['Simulation', 'First leg contact [ms]', 'First head contact [ms]', 'Simulation HIT [ms]'])
hit_df['Experimental HIT [ms]'] = np.array(head_time_exp)
display(hit_df)

create_subplots(
figure_title = 'Head and leg contact force',
sim_x_data = ('HBM', 'HBM_Leg_Vehicle_Contact_Transducer_x_force', 'time'),
sim_y_data = ('HBM', 'HBM_Leg_Vehicle_Contact_Transducer_x_force', 'force'),
sim_x_data2 = ('HBM', 'HBM_Leg_Vehicle_Contact_Transducer_z_force', 'time'),
sim_y_data2 = ('HBM', 'HBM_Leg_Vehicle_Contact_Transducer_z_force', 'force'),
sim_x_data3 = ('HBM', 'HBM_Head_Vehicle_Contact_Transducer_x_force', 'time'),
sim_y_data3 = ('HBM', 'HBM_Head_Vehicle_Contact_Transducer_x_force', 'force'),
sim_x_data4 = ('HBM', 'HBM_Head_Vehicle_Contact_Transducer_z_force', 'time'),
sim_y_data4 = ('HBM', 'HBM_Head_Vehicle_Contact_Transducer_z_force', 'force'),
sim_name1_legend = 'leg x force',
sim_name2_legend = 'leg z force',
sim_name3_legend = 'head x force',
sim_name4_legend = 'head z force',
x_label = 'Time [ms]',
y_label = 'Contact force [kN]',
vertical_line1 = list(map(float, (hit_df['First leg contact [ms]'].tolist()))),
vertical_line2 = list(map(float, (hit_df['First head contact [ms]'].tolist()))),
x_lim = [0, 200],
y_lim = [0, 15],
)
| Simulation | First leg contact [ms] | First head contact [ms] | Simulation HIT [ms] | Experimental HIT [ms] | |
|---|---|---|---|---|---|
| 0 | Test_V2370 | 4.502251125562781 | 134.26713356678337 | 130 | 135 |
| 1 | Test_V2371 | 0.80040020010005 | 137.7688844422211 | 137 | 138 |
| 2 | Test_V2374 | 2.0010005002501248 | 135.06753376688343 | 133 | 141 |
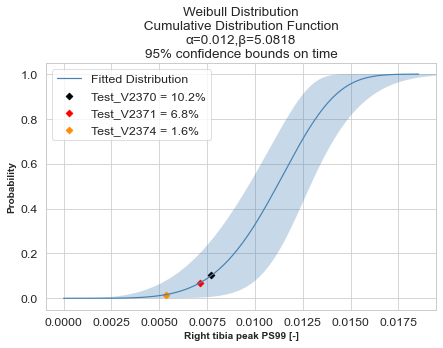
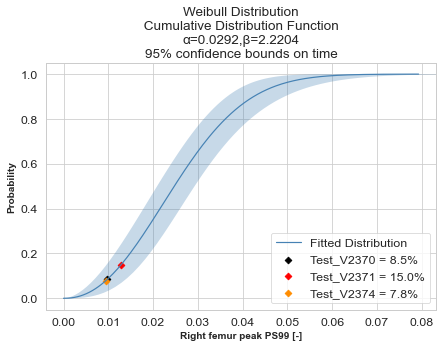
Plotting peak strains of tibia and femur on IRCs#
Show code cell source
def find_peak_strains(title, x_data, y_data):
    list = []
    for i in simulation_list:
        processed_data_path = os.path.join(processed_data_dir, i).replace('\\', '/')
        simData = pd.read_csv(os.path.join(processed_data_path, dynasaur_output_file_name),
                                    delimiter=';', na_values='-', header = [0,1,2,3])

        sim_x_data = np.array(simData[x_data]).flatten()
        sim_y_data = np.array(simData[y_data]).flatten()

        peak_strain_ind = np.nanargmax(sim_y_data)
        peak_time = sim_x_data[peak_strain_ind]
        peak_strain = sim_y_data[peak_strain_ind]
        list.append([i, peak_time, peak_strain])

    list = np.reshape(list, (len(simulation_list), 3))
    return list

def plot_peak_strains_on_irc(x_label, filename_strains_irc, peak_strain_array):
    plotTest_V2370 = { "marker" :'D', "color" : 'black',}
    plotTest_V2371 = { "marker" :'D', "color" : 'red', }
    plotTest_V2374 = { "marker" :'D', "color" : 'darkorange',}

    sim_strain_data = peak_strain_array[:,2].astype(float)
    sim_name_data = peak_strain_array[:,0]
    df_strains_irc = pd.read_csv(filename_strains_irc, sep = ";")

    plt.figure(figsize=(7,5))
    weibull_fit = Fit_Weibull_2P(failures=list(df_strains_irc.PS99),show_probability_plot=False,print_results=False, CI=0.95, CI_type="time")

    weibull_fit.distribution.CDF(label='Fitted Distribution',color='steelblue')
    plt.xlabel(x_label, fontweight='semibold',fontsize=10)
    plt.ylabel("Probability",fontweight='semibold',fontsize=10)

    x_values = sim_strain_data.flatten()
    axs = plt.gca()
    line = axs.lines[0]
    IRC_distrib_x = line.get_xdata()
    IRC_distrib_y = line.get_ydata()

    probability_list = []
    for x in range(len(x_values)):
        smaller_values = np.where(IRC_distrib_x < x_values[x])
        bigger_values = np.where(IRC_distrib_x > x_values[x])

        ind_small = smaller_values[0][-1]
        ind_big = ind_small+1

        if ind_small == 199:
            y_value = 0.9999
        else:
            x_interp_array = [IRC_distrib_x[ind_small],IRC_distrib_x[ind_big]]
            y_interp_array = [IRC_distrib_y[ind_small],IRC_distrib_y[ind_big]]
            y_value = np.interp(x_values[x],x_interp_array,y_interp_array)

        simPlot = locals()["plot" + sim_name_data[x]]
        plt.scatter(x_values[x], y_value,**simPlot,label=sim_name_data[x] + ' = ' + str(round(y_value*100,1)) + '%')
        plt.legend(loc=0)
        probability_list.append(y_value*100)
    return(probability_list)
Show code cell source
tibia_exp_fracture = ['no', 'no', 'no']
femur_exp_fracture = ['no', 'no', 'no']

tibia_PS99_peak_strain_array = find_peak_strains(
title = 'Tibia PS99 strain',
x_data = ('BONES', 'Tibia_Cortical_R_PS99', 'time'),
y_data = ('BONES', 'Tibia_Cortical_R_PS99', 'strain')
)

femur_PS99_peak_strain_array = find_peak_strains(
title = 'Femur PS99 strain',
x_data = ('BONES', 'Femur_Cortical_R_PS99', 'time'),
y_data = ('BONES', 'Femur_Cortical_R_PS99', 'strain')
)

probability_list_tibia = plot_peak_strains_on_irc(
peak_strain_array = tibia_PS99_peak_strain_array,
x_label = 'Right tibia peak PS99 [-]',
filename_strains_irc = 'data/metadata/Tibia_injury-risk-curve/strains_tibia_for_IRC.csv'
)

probability_list_femur = plot_peak_strains_on_irc(
peak_strain_array = femur_PS99_peak_strain_array,
x_label = 'Right femur peak PS99 [-]',
filename_strains_irc = 'data/metadata/Femur_injury-risk-curve/Schubert-2020_Femur_All-Strain-Curves-for-FRC.csv'
)

fracture_risks_df = pd.DataFrame({'Simulation': simulation_list,
                                'Tibia fracture probability [%]': probability_list_tibia,
                                'Experiment tibia fracture': np.array(tibia_exp_fracture),
                                'Femur fracture probability [%]': probability_list_femur,
                                'Experiment femur fracture': np.array(femur_exp_fracture),})

display(fracture_risks_df)
| Simulation | Tibia fracture probability [%] | Experiment tibia fracture | Femur fracture probability [%] | Experiment femur fracture | |
|---|---|---|---|---|---|
| 0 | Test_V2370 | 10.1977 | no | 8.48424 | no |
| 1 | Test_V2371 | 6.79441 | no | 15.0103 | no |
| 2 | Test_V2374 | 1.61808 | no | 7.83302 | no |